
|
SECURITIES AND EXCHANGE COMMISSION
Washington, D.C. 20549 |
SCHEDULE 13D
Under the Securities Exchange Act of 1934
(Amendment No. 23)*
|
Howard Hughes Holdings Inc. (Name of Issuer) |
Common Stock, par value $0.01 per share (Title of Class of Securities) |
44267T102 (CUSIP Number) |
Halit Coussin Pershing Square Capital Management, L.P., 787 Eleventh Avenue, 9th Floor New York, NY, 10019 (212) 813-3700 (Name, Address and Telephone Number of Person Authorized to Receive Notices and Communications) |
02/13/2025 (Date of Event Which Requires Filing of This Statement) |
If the filing person has previously filed a statement on Schedule 13G to report the acquisition that is the subject of this Schedule 13D, and is filing this schedule because of §§ 240.13d-1(e), 240.13d-1(f) or 240.13d-1(g), check the following box.

The information required on the remainder of this cover page shall not be deemed to be “filed” for the purpose of Section 18 of the
Securities Exchange Act of 1934 (“Act”) or otherwise subject to the liabilities of that section of the Act but shall be subject to all other
provisions of the Act (however, see the Notes).
SCHEDULE 13D
|
| CUSIP No. | 44267T102 |
| 1 |
Name of reporting person
Pershing Square Capital Management, L.P. | ||||||||
| 2 | Check the appropriate box if a member of a Group (See Instructions)
(a)
(b)
| ||||||||
| 3 | SEC use only | ||||||||
| 4 |
Source of funds (See Instructions)
OO | ||||||||
| 5 |
Check if disclosure of legal proceedings is required pursuant to Items 2(d) or 2(e)
| ||||||||
| 6 | Citizenship or place of organization
DELAWARE
| ||||||||
| Number of Shares Beneficially Owned by Each Reporting Person With: |
| ||||||||
| 11 | Aggregate amount beneficially owned by each reporting person
18,852,064.00 | ||||||||
| 12 | Check if the aggregate amount in Row (11) excludes certain shares (See Instructions)
| ||||||||
| 13 | Percent of class represented by amount in Row (11)
37.6 % | ||||||||
| 14 | Type of Reporting Person (See Instructions)
IA |
Comment for Type of Reporting Person:
Item 13 Footnote: This calculation is based on 50,137,514 shares of Common Stock outstanding as of October 28, 2024, as reported in the Form 10-Q.
SCHEDULE 13D
|
| CUSIP No. | 44267T102 |
| 1 |
Name of reporting person
Pershing Square Holdco, L.P. | ||||||||
| 2 | Check the appropriate box if a member of a Group (See Instructions)
(a)
(b)
| ||||||||
| 3 | SEC use only | ||||||||
| 4 |
Source of funds (See Instructions)
OO | ||||||||
| 5 |
Check if disclosure of legal proceedings is required pursuant to Items 2(d) or 2(e)
| ||||||||
| 6 | Citizenship or place of organization
DELAWARE
| ||||||||
| Number of Shares Beneficially Owned by Each Reporting Person With: |
| ||||||||
| 11 | Aggregate amount beneficially owned by each reporting person
18,852,064.00 | ||||||||
| 12 | Check if the aggregate amount in Row (11) excludes certain shares (See Instructions)
| ||||||||
| 13 | Percent of class represented by amount in Row (11)
37.6 % | ||||||||
| 14 | Type of Reporting Person (See Instructions)
PN |
Comment for Type of Reporting Person:
Item 13 Footnote: This calculation is based on 50,137,514 shares of Common Stock outstanding as of October 28, 2024, as reported in the Form 10-Q.
SCHEDULE 13D
|
| CUSIP No. | 44267T102 |
| 1 |
Name of reporting person
Pershing Square Holdco GP, LLC | ||||||||
| 2 | Check the appropriate box if a member of a Group (See Instructions)
(a)
(b)
| ||||||||
| 3 | SEC use only | ||||||||
| 4 |
Source of funds (See Instructions)
OO | ||||||||
| 5 |
Check if disclosure of legal proceedings is required pursuant to Items 2(d) or 2(e)
| ||||||||
| 6 | Citizenship or place of organization
DELAWARE
| ||||||||
| Number of Shares Beneficially Owned by Each Reporting Person With: |
| ||||||||
| 11 | Aggregate amount beneficially owned by each reporting person
18,852,064.00 | ||||||||
| 12 | Check if the aggregate amount in Row (11) excludes certain shares (See Instructions)
| ||||||||
| 13 | Percent of class represented by amount in Row (11)
37.6 % | ||||||||
| 14 | Type of Reporting Person (See Instructions)
OO |
Comment for Type of Reporting Person:
Item 13 Footnote: This calculation is based on 50,137,514 shares of Common Stock outstanding as of October 28, 2024, as reported in the Form 10-Q.
SCHEDULE 13D
|
| CUSIP No. | 44267T102 |
| 1 |
Name of reporting person
PS Holdco GP Managing Member, LLC | ||||||||
| 2 | Check the appropriate box if a member of a Group (See Instructions)
(a)
(b)
| ||||||||
| 3 | SEC use only | ||||||||
| 4 |
Source of funds (See Instructions)
OO | ||||||||
| 5 |
Check if disclosure of legal proceedings is required pursuant to Items 2(d) or 2(e)
| ||||||||
| 6 | Citizenship or place of organization
DELAWARE
| ||||||||
| Number of Shares Beneficially Owned by Each Reporting Person With: |
| ||||||||
| 11 | Aggregate amount beneficially owned by each reporting person
18,852,064.00 | ||||||||
| 12 | Check if the aggregate amount in Row (11) excludes certain shares (See Instructions)
| ||||||||
| 13 | Percent of class represented by amount in Row (11)
37.6 % | ||||||||
| 14 | Type of Reporting Person (See Instructions)
OO |
Comment for Type of Reporting Person:
Item 13 Footnote: This calculation is based on 50,137,514 shares of Common Stock outstanding as of October 28, 2024, as reported in the Form 10-Q.
SCHEDULE 13D
|
| CUSIP No. | 44267T102 |
| 1 |
Name of reporting person
William A. Ackman | ||||||||
| 2 | Check the appropriate box if a member of a Group (See Instructions)
(a)
(b)
| ||||||||
| 3 | SEC use only | ||||||||
| 4 |
Source of funds (See Instructions)
OO | ||||||||
| 5 |
Check if disclosure of legal proceedings is required pursuant to Items 2(d) or 2(e)
| ||||||||
| 6 | Citizenship or place of organization
UNITED STATES
| ||||||||
| Number of Shares Beneficially Owned by Each Reporting Person With: |
| ||||||||
| 11 | Aggregate amount beneficially owned by each reporting person
18,852,064.00 | ||||||||
| 12 | Check if the aggregate amount in Row (11) excludes certain shares (See Instructions)
| ||||||||
| 13 | Percent of class represented by amount in Row (11)
37.6 % | ||||||||
| 14 | Type of Reporting Person (See Instructions)
IN |
Comment for Type of Reporting Person:
Item 13 Footnote: This calculation is based on 50,137,514 shares of Common Stock outstanding as of October 28, 2024, as reported in the Form 10-Q.
SCHEDULE 13D
|
| Item 1. | Security and Issuer | |
| (a) | Title of Class of Securities:
Common Stock, par value $0.01 per share | |
| (b) | Name of Issuer:
Howard Hughes Holdings Inc. | |
| (c) | Address of Issuer's Principal Executive Offices:
9950 WOODLOCH FOREST DRIVE, 11TH FLOOR, THE WOODLANDS,
TEXAS
, 77380. | |
Item 1 Comment:
This amendment No. 23 ("Amendment No. 23") to Schedule 13D is being filed on behalf of the Reporting Persons relating to the common stock, par value $0.01 per share, of Howard Hughes Holdings Inc., a Delaware corporation (the "Issuer"). This Amendment No. 23 modifies the original Schedule 13D filed on December 4, 2019 (as amended and supplemented prior to the filing of this Amendment No. 23, the "Schedule 13D") by (i) Pershing Square Capital Management, L.P., a Delaware limited partnership, (ii) PS Management GP, LLC, a Delaware limited liability company, and (iii) William A. Ackman, a citizen of the United States.
Capitalized terms used but not defined in this Amendment No. 23 shall have the meanings set forth in the Schedule 13D.
Except as specifically amended by this Amendment No. 23, the Schedule 13D is unchanged. | ||
| Item 2. | Identity and Background | |
| (a) | Item 2(a) of the Schedule 13D is hereby amended and supplemented by adding the following information:
"The information set forth in Exhibit 99.24 is incorporated by reference into this Item 2(a) as if restated in full." | |
| (b) | Item 2(b) of the Schedule 13D is hereby amended and supplemented by adding the following information:
"The information set forth in Exhibit 99.24 is incorporated by reference into this Item 2(b) as if restated in full." | |
| (c) | Item 2(c) of the Schedule 13D is hereby amended and supplemented by adding the following information:
"The information set forth in Exhibit 99.24 is incorporated by reference into this Item 2(c) as if restated in full." | |
| Item 3. | Source and Amount of Funds or Other Consideration | |
Item 3 of the Schedule 13D is hereby amended and supplemented by adding the following information:
"The information set forth in Item 4 of Amendment No. 23 is incorporated by reference into this Item 3 as if restated in full." | ||
| Item 4. | Purpose of Transaction | |
Item 4 of the Schedule 13D is hereby amended and supplemented by adding the following information:
"After productive discussions with the Special Committee of independent directors of the Board of Directors of the Issuer, including a meeting on February 13, 2025, PS Holdco has determined to withdraw its previously disclosed non-binding Proposal of January 13, 2025 in order to put forward an improved non-binding proposal (the "New Proposal"), as further discussed below.
Under the New Proposal, PS Holdco would invest $900 million in a primary purchase of Common Stock of the Issuer at a price of $90 per share, which represents a 46.4% premium to the $61.46 unaffected price of the Common Stock on August 5, 2024 (i.e., the closing price on August 5, 2024 prior to the Reporting Persons' August 6, 2024 amendment of its Schedule 13D announcing its intention to evaluate a potential transaction with the Issuer including possibly a going private transaction).
The investment is expected to be funded by existing cash on PS Holdco's balance sheet and will not require any financing.
The shares of Common Stock acquired by PS Holdco would be in addition to the Reporting Persons' and Pershing Square Funds' current beneficial ownership of the Common Stock reported in the Schedule 13D. After giving effect to the $900 million investment, the Reporting Persons' beneficial ownership would increase from 37.6% to 48.0%.
PS Holdco would have certain protective rights in light of its status as a minority shareholder with significant economic exposure to the Issuer. These protections would include anti-dilution provisions as well as limited consent rights, such as in the case of amendments to the Issuer's constituent documents, significant incurrences of indebtedness, significant acquisitions or dispositions, merger or dissolution of the Issuer, and other fundamental corporate events, including director nomination rights.
Under the New Proposal, the Issuer will become a diversified holding company that pursues the acquisition of controlling interests in public and private companies. The Issuer will have PS Holdco and its affiliates' full resources available to it. In consideration for the services rendered, PS Holdco will receive a fee of 1.5% per annum of the equity market capitalization of the Issuer.
The Reporting Persons are also prepared to subject the New Proposal to the prior approval of the Special Committee.
No assurances can be given regarding the terms and details of any potential transaction, that the New Proposal or any other proposal made by the Reporting Persons regarding any potential transaction will be accepted by the Issuer or its Special Committee, that definitive documents relating to any such potential transaction will be executed, or that a potential transaction will be consummated in accordance with such documents, if at all.
Attached as Exhibit 99.23 to the Schedule 13D are excerpts of materials (the "Excerpts of Special Committee Presentation") used by representatives of PS Holdco, in its February 13, 2025 meeting with the Issuer's Special Committee, subject to non-substantive presentation changes for purposes of public disclosure. Slides 1-14 of the Excerpts of Special Committee Presentation which describe the New Proposal are incorporated herein by reference. The foregoing description of the New Proposal is not necessarily complete and is qualified in its entirety by reference to the incorporated Excerpts of Special Committee Presentation.
Neither the Schedule 13D nor the New Proposal is an offer to purchase or a solicitation of an offer to sell any securities. Any solicitation or offer will only be made through separate materials filed with the U.S. Securities and Exchange Commission.
Holders of Common Stock of the Issuer and other interested parties are urged to read these materials when and if they become available because they will contain important information. Holders of Common Stock of the Issuer will be able to obtain such documents (when and if available) free of charge at the Commission's web site, www.sec.gov.
The Reporting Persons reserve the right to modify or withdraw the New Proposal at any time. While the New Proposal remains under consideration by the Issuer, the Reporting Persons expect to respond to inquiries from, and negotiate the terms of the New Proposal with, the Special Committee of the Issuer's Board of Directors formed to evaluate the New Proposal and such Special Committee's representatives. The Reporting Persons may elect not to update or provide additional disclosures regarding the New Proposal until a definitive agreement has been reached, or unless disclosure is otherwise required under applicable securities laws." | ||
| Item 6. | Contracts, Arrangements, Understandings or Relationships With Respect to Securities of the Issuer | |
Item 6 of the Schedule 13D is hereby amended and supplemented by adding the following information:
"The information set forth in Item 4 of Amendment No. 23 is incorporated by reference into this Item 6 as if restated in full." | ||
| Item 7. | Material to be Filed as Exhibits. | |
Item 7 of the Schedule 13D is hereby amended and supplemented by adding a reference to the following exhibits:
Exhibit 99.23 Excerpts of Special Committee Presentation, delivered February 13, 2025 by PS Holdco to the Special Committee of the Board of Directors of the Issuer.
Exhibit 99.24 Members of PS Holdco GP Managing Member, LLC | ||
| SIGNATURE | |
After reasonable inquiry and to the best of my knowledge and belief, I certify that the information set forth in this statement is true, complete and correct.
|
|
|
|
|
|
|
|
|
|
|
Exhibit 99.23

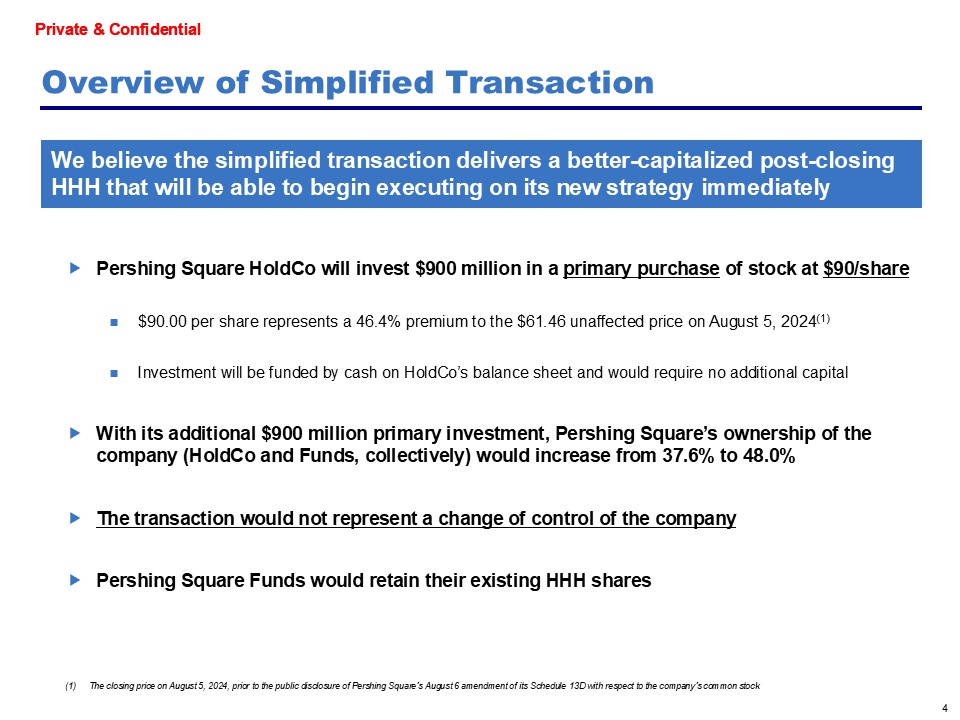
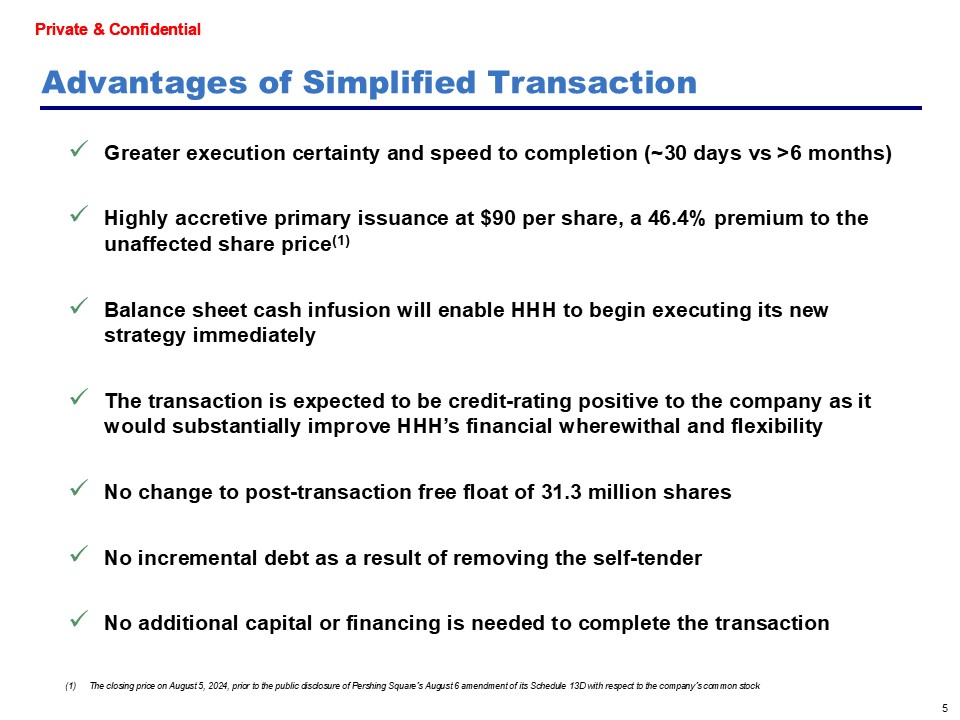
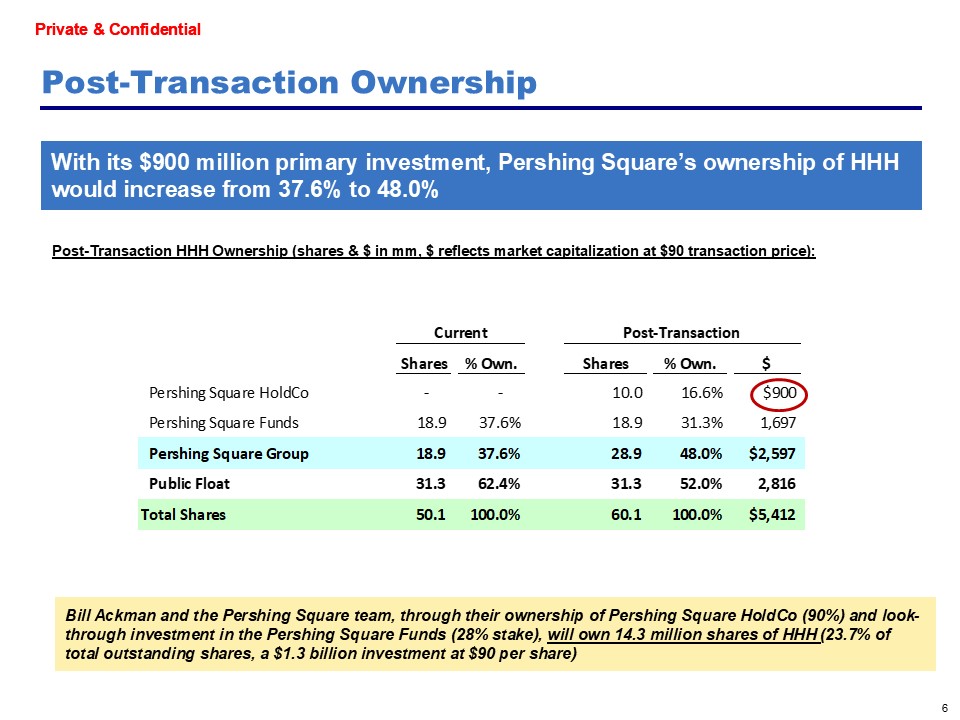
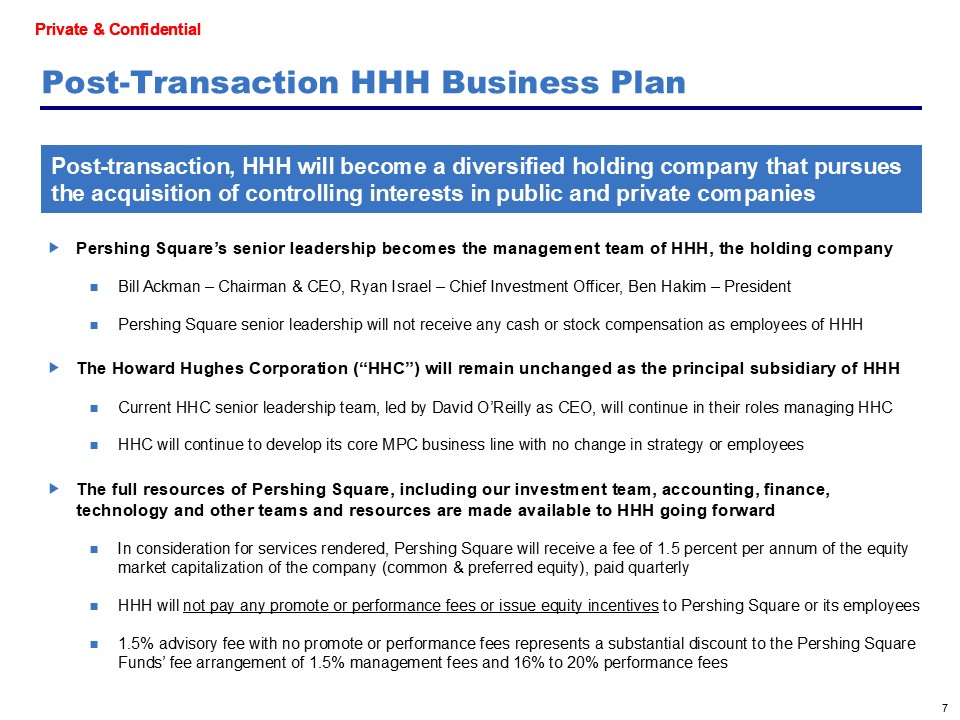
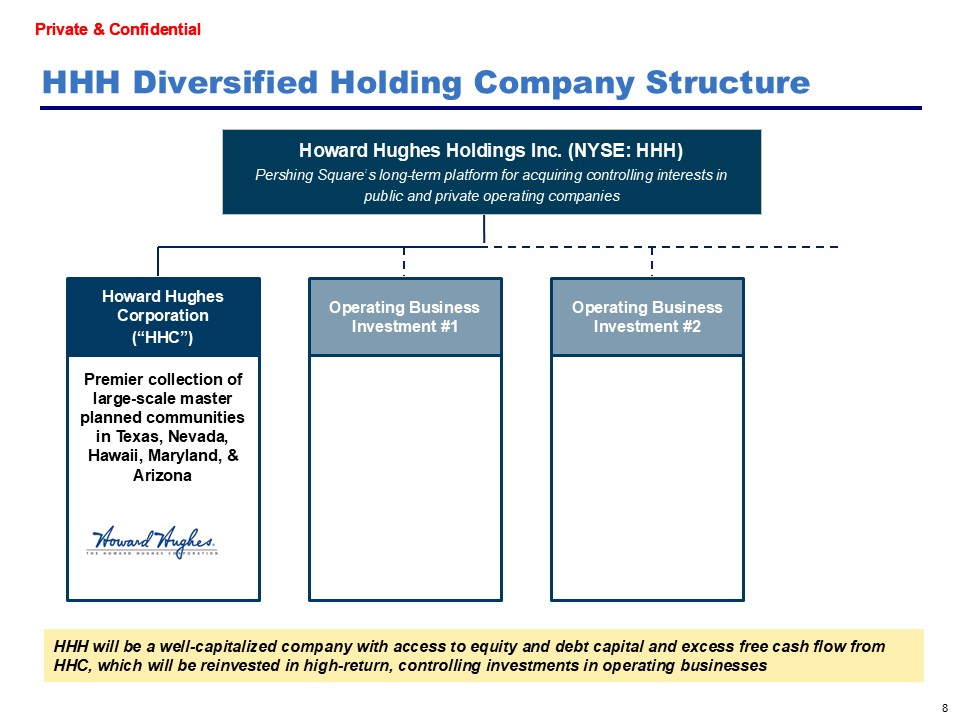
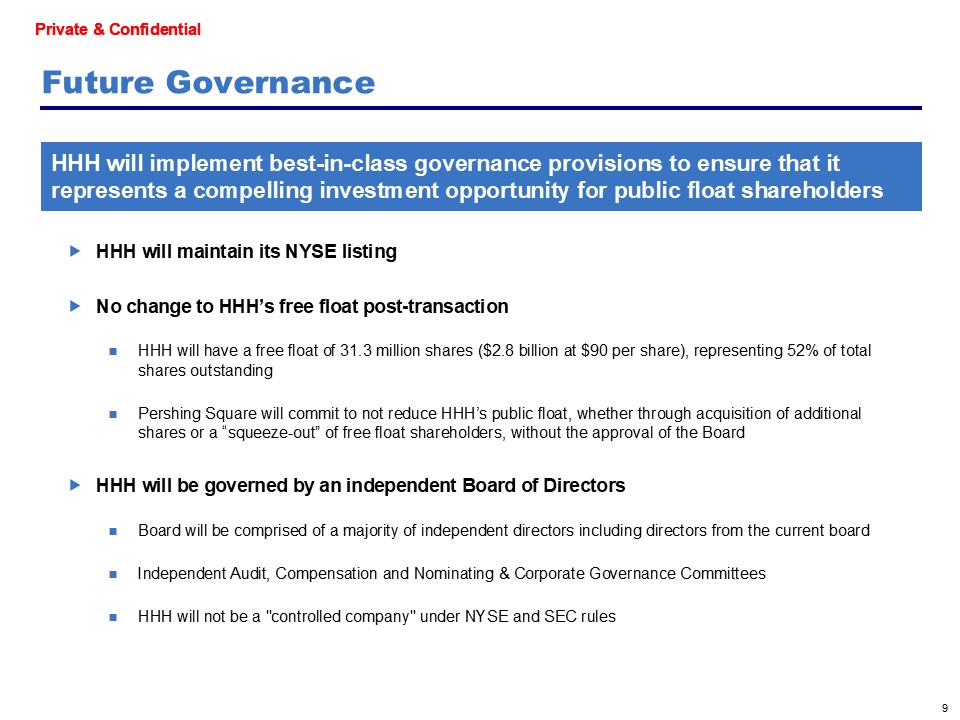
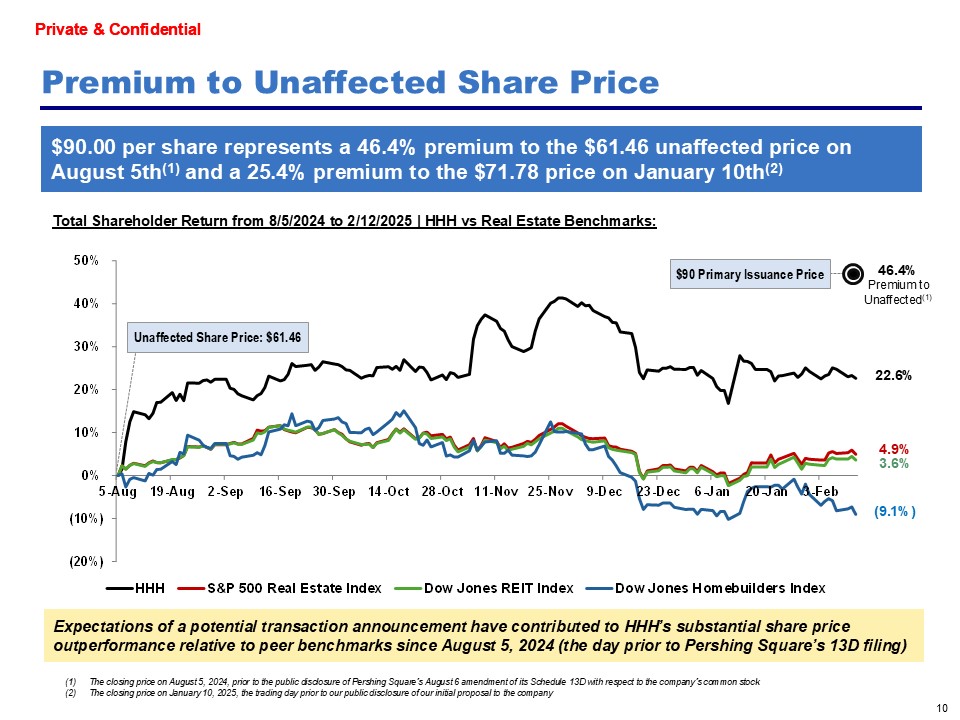
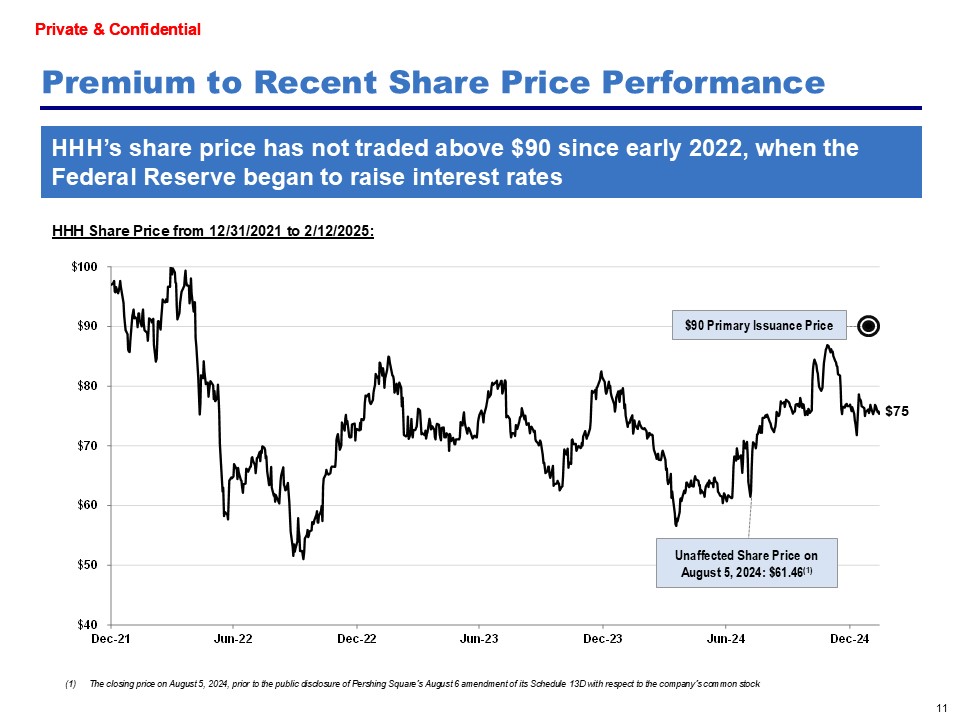
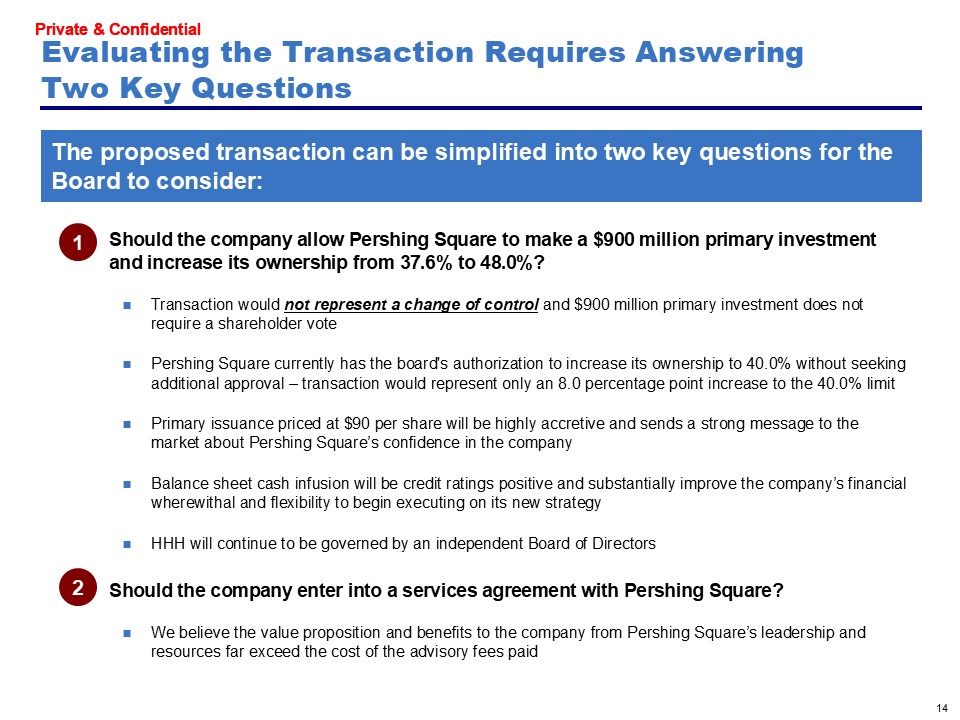

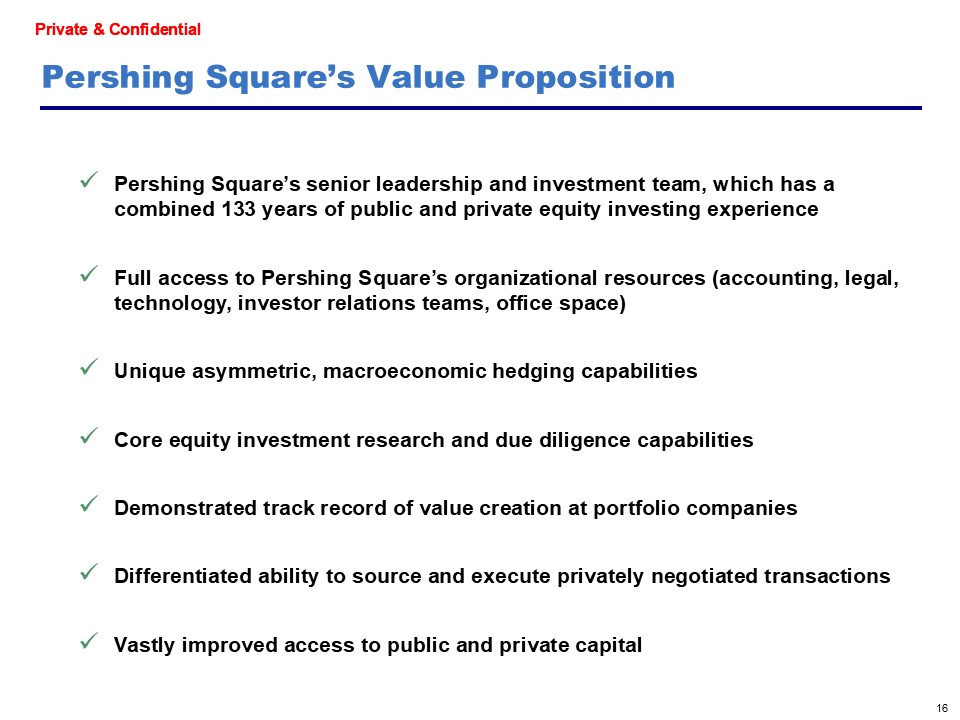
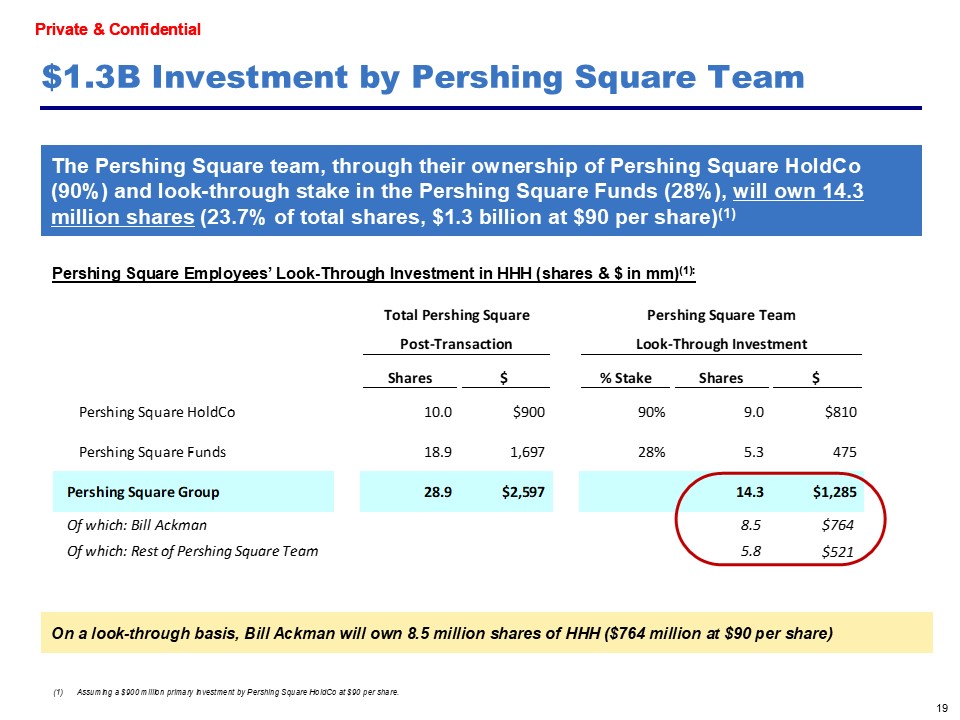
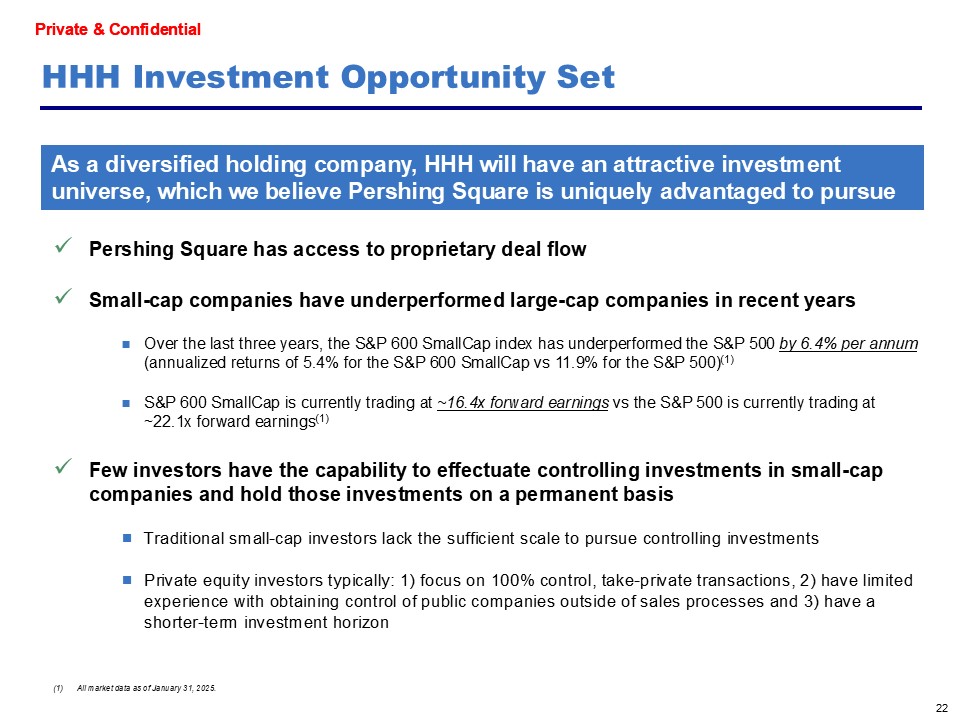
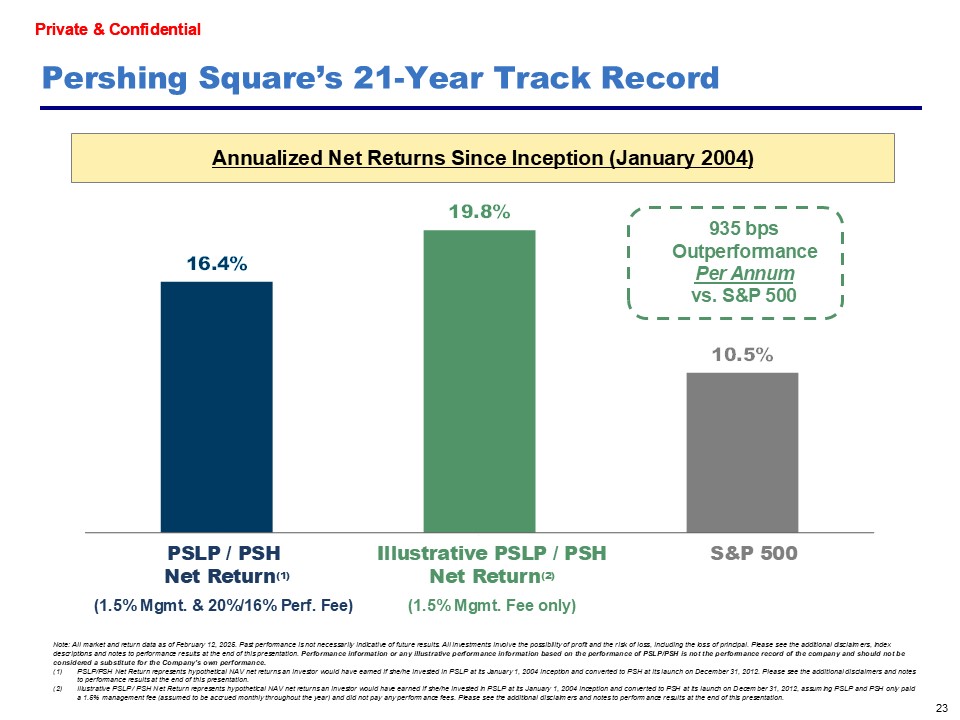
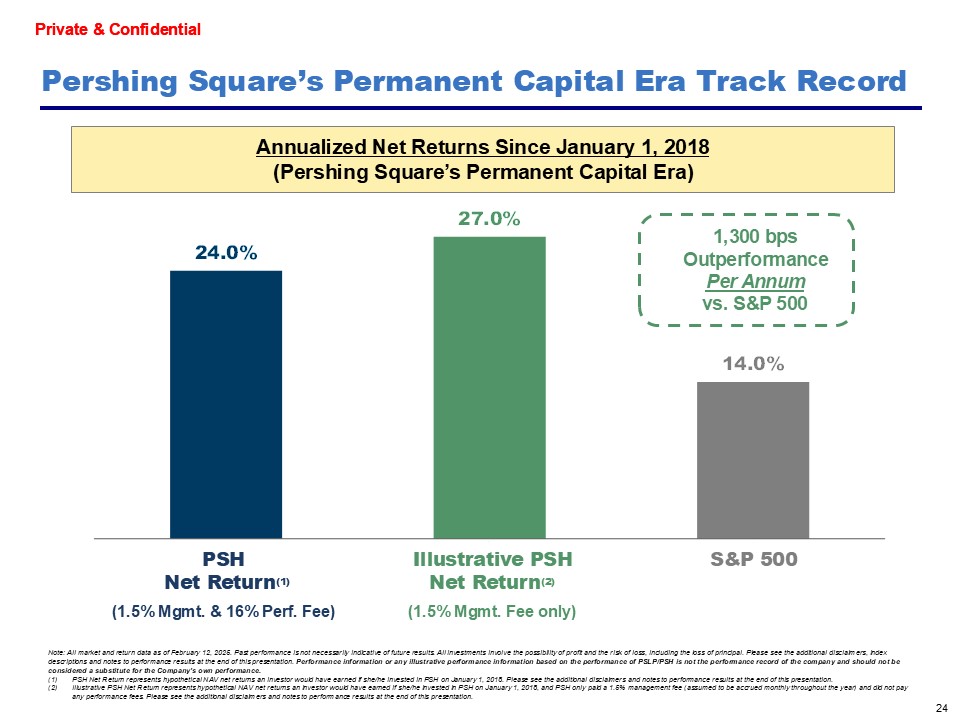
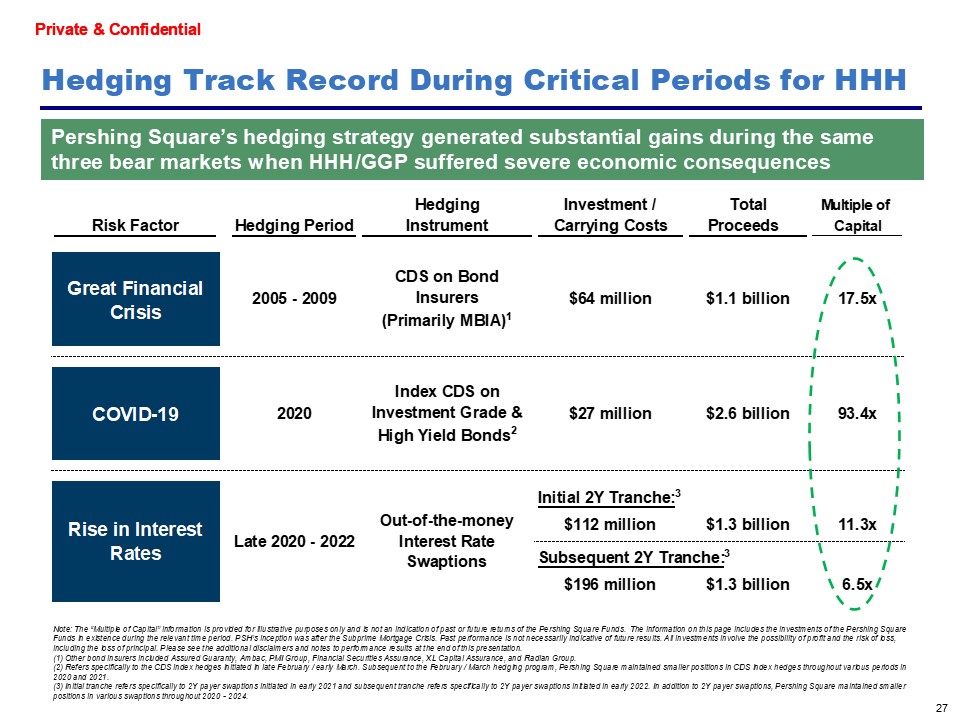
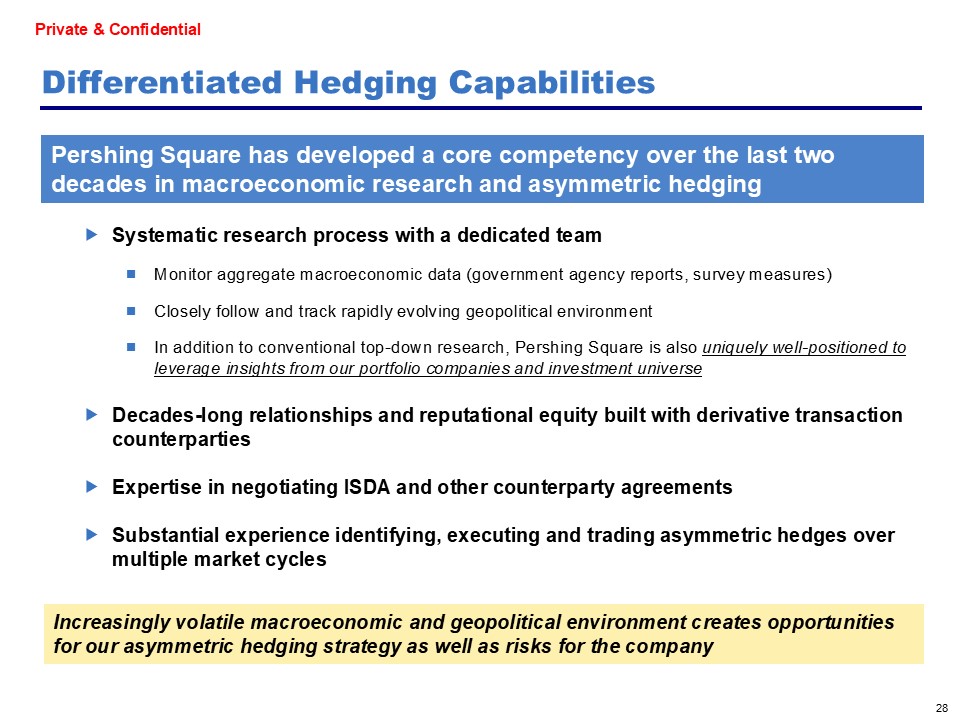
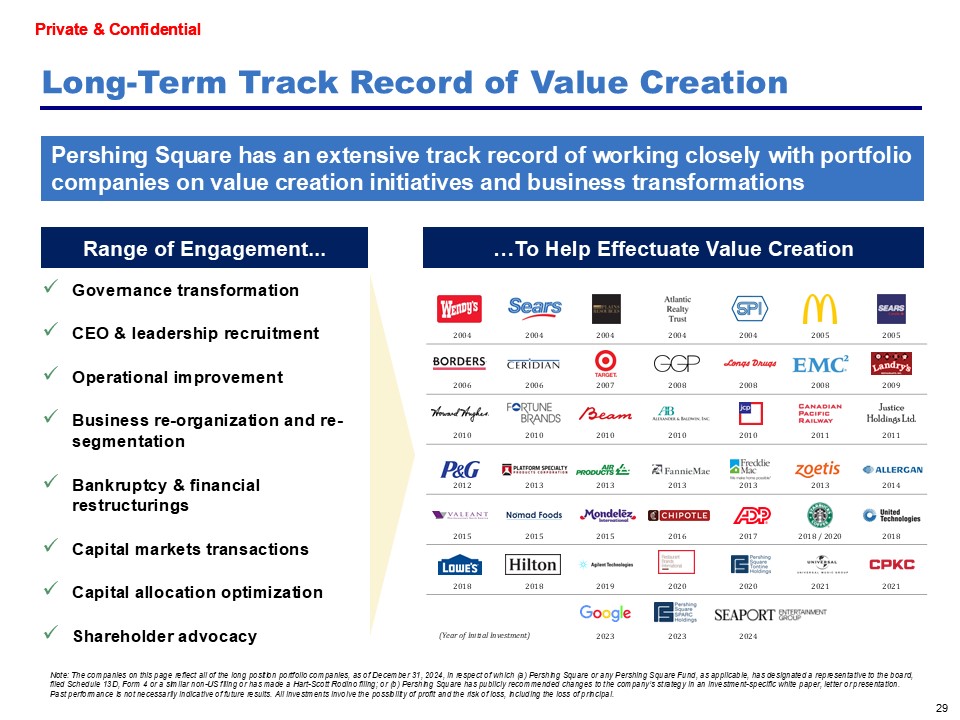
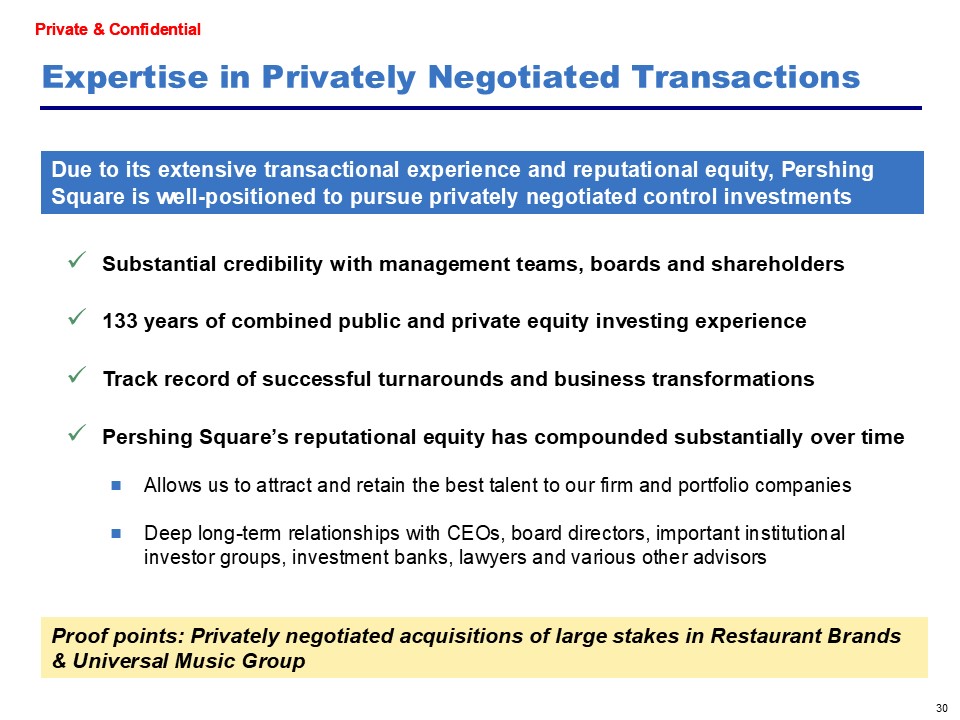
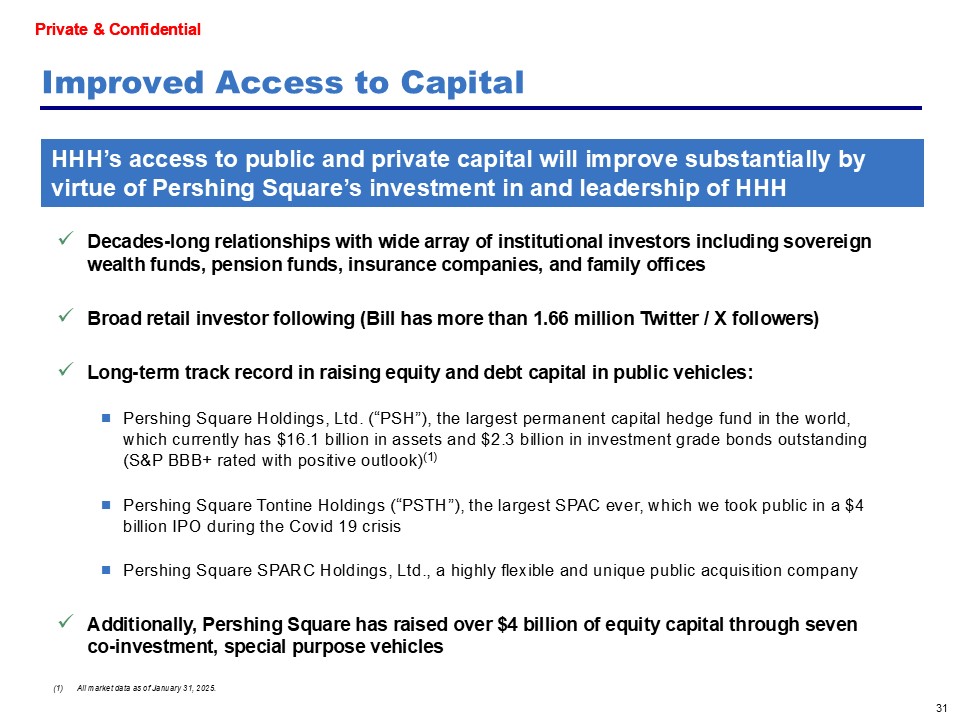

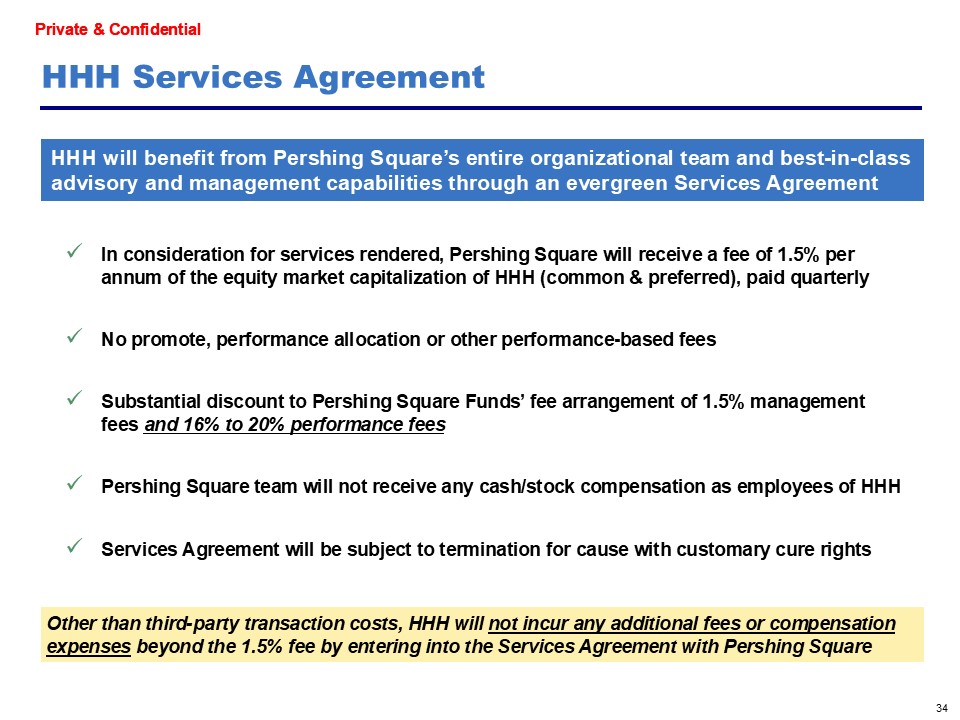
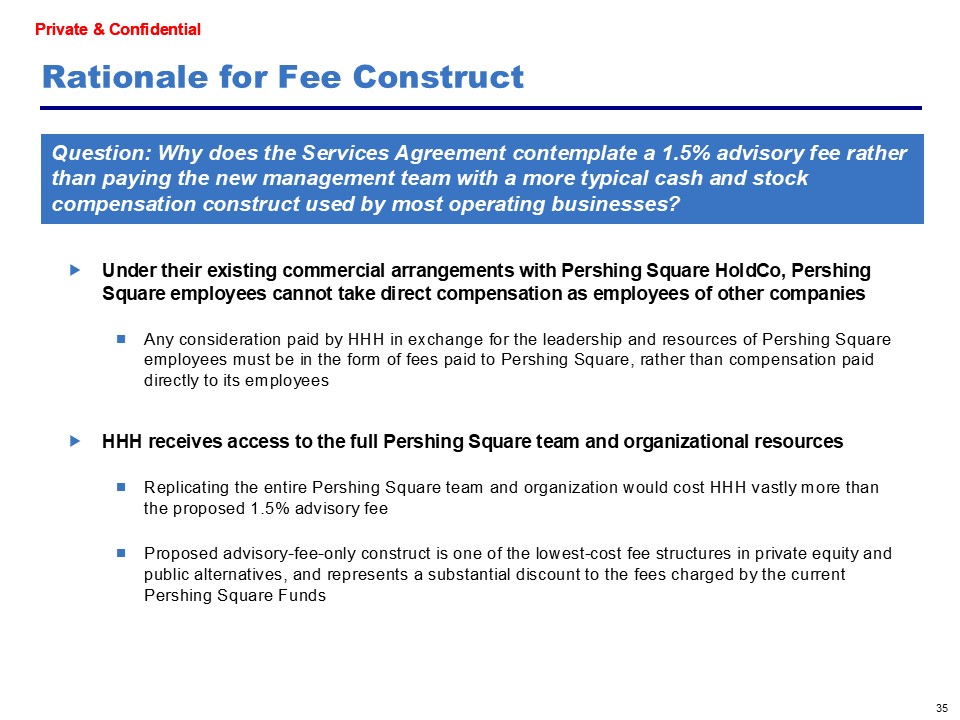
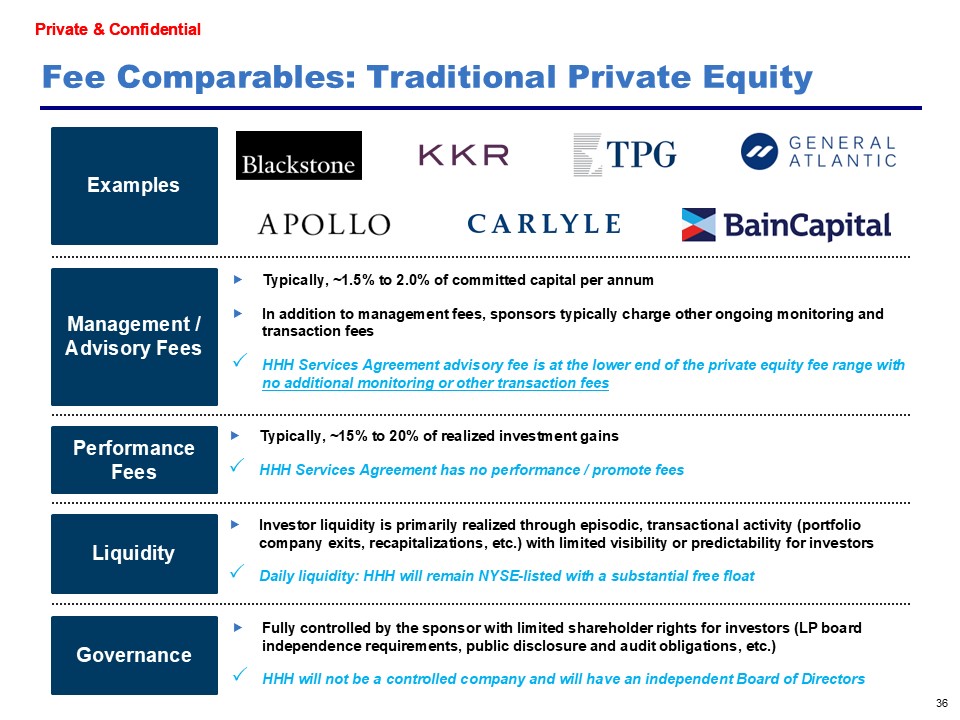
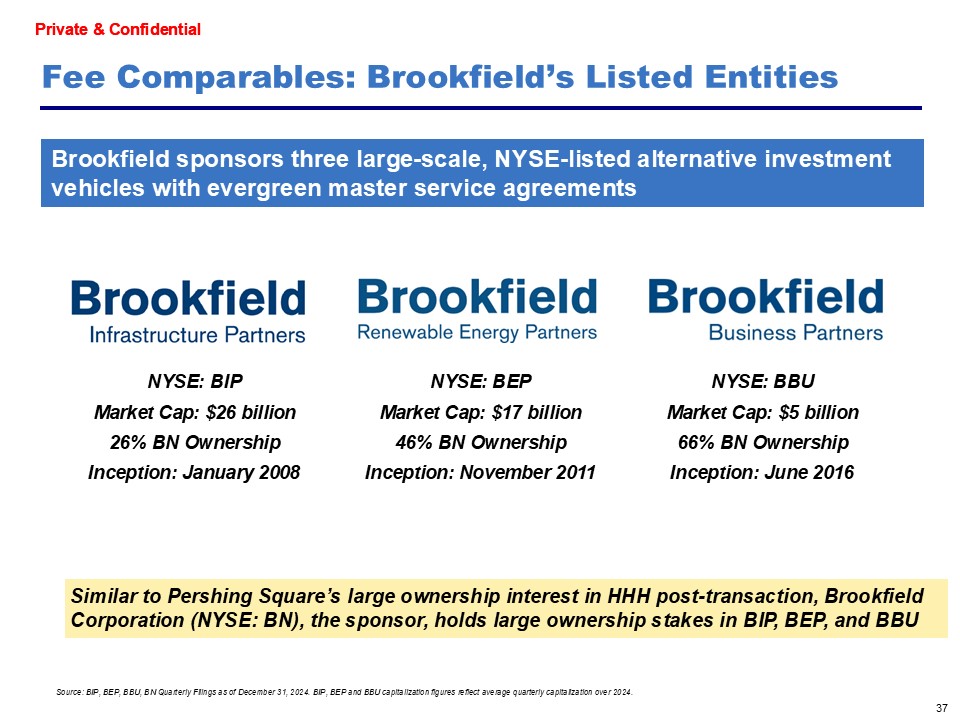
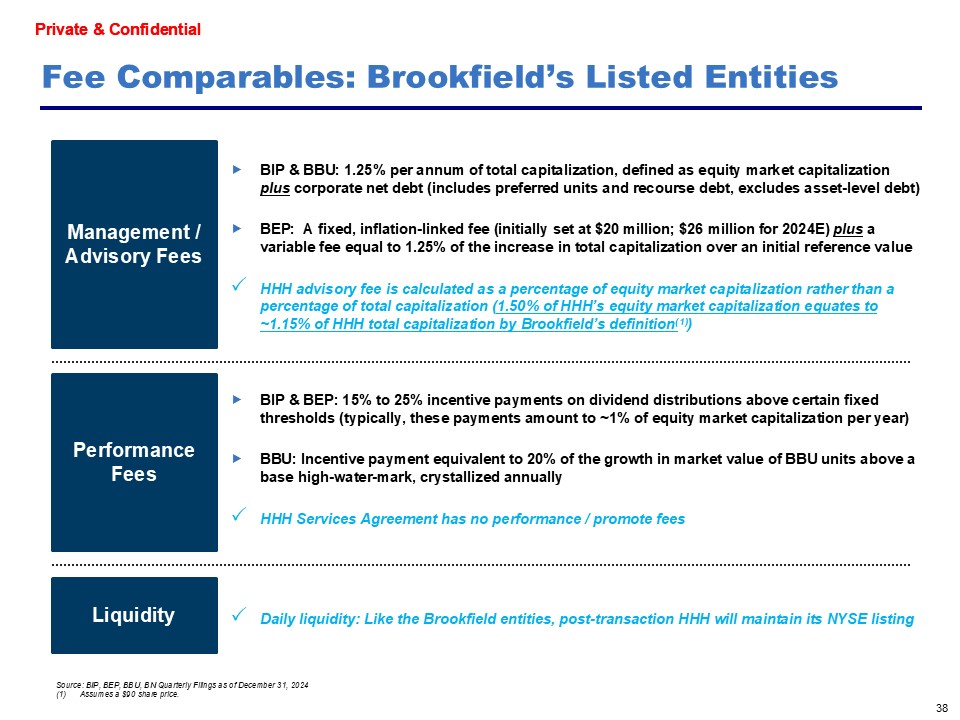
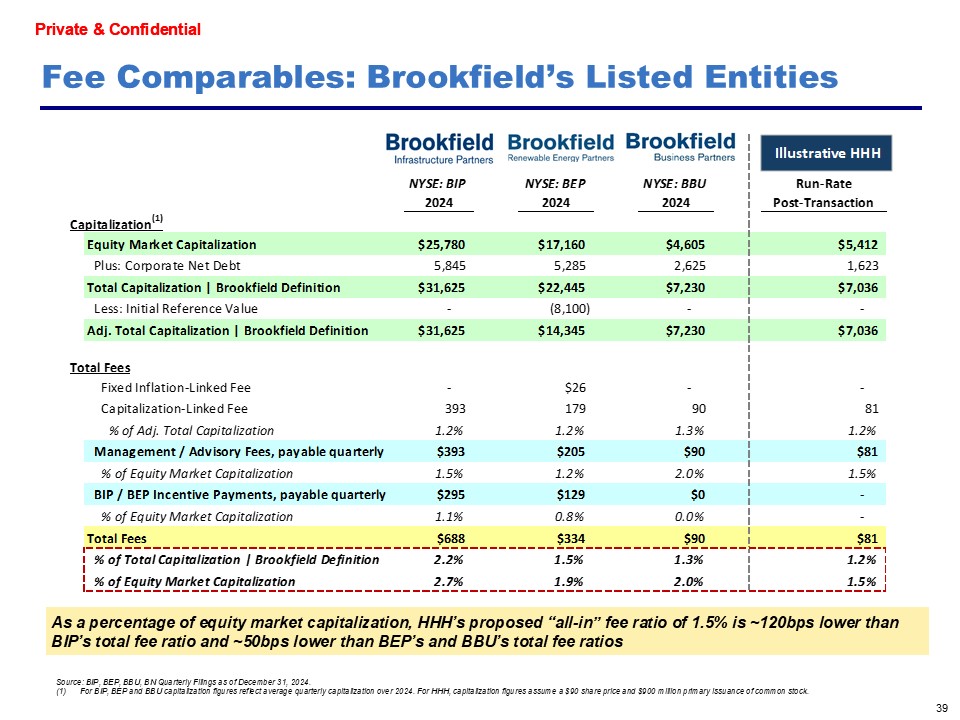
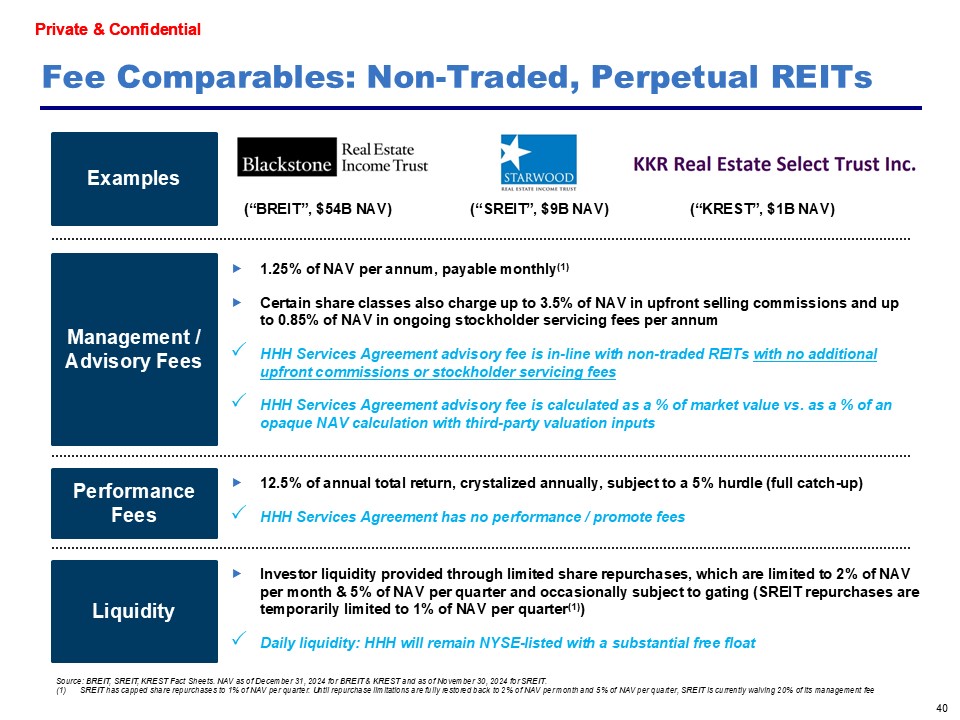
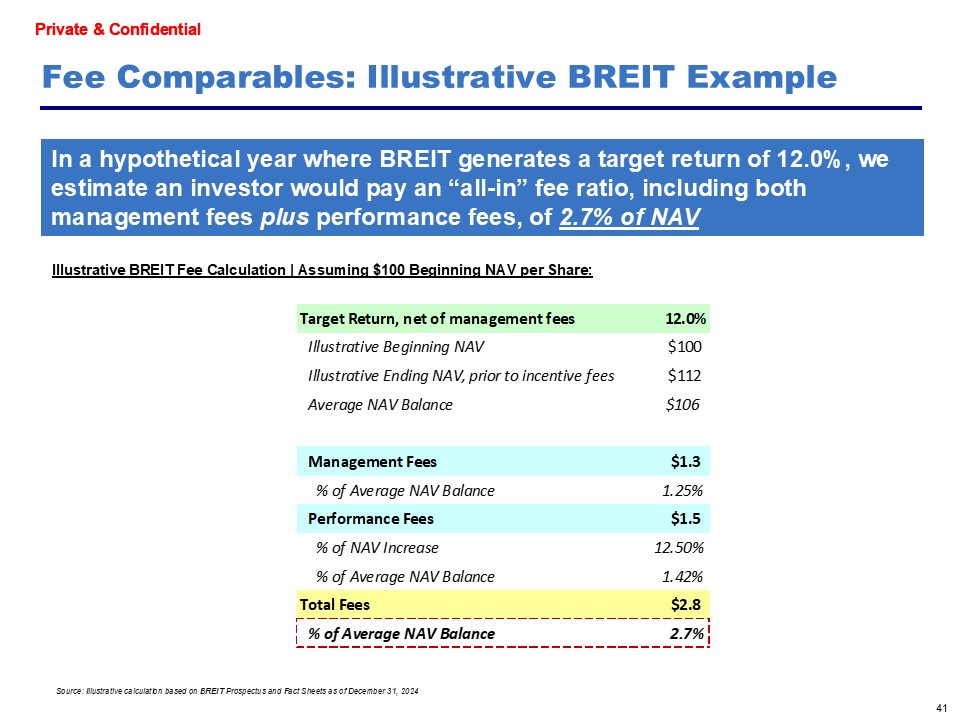
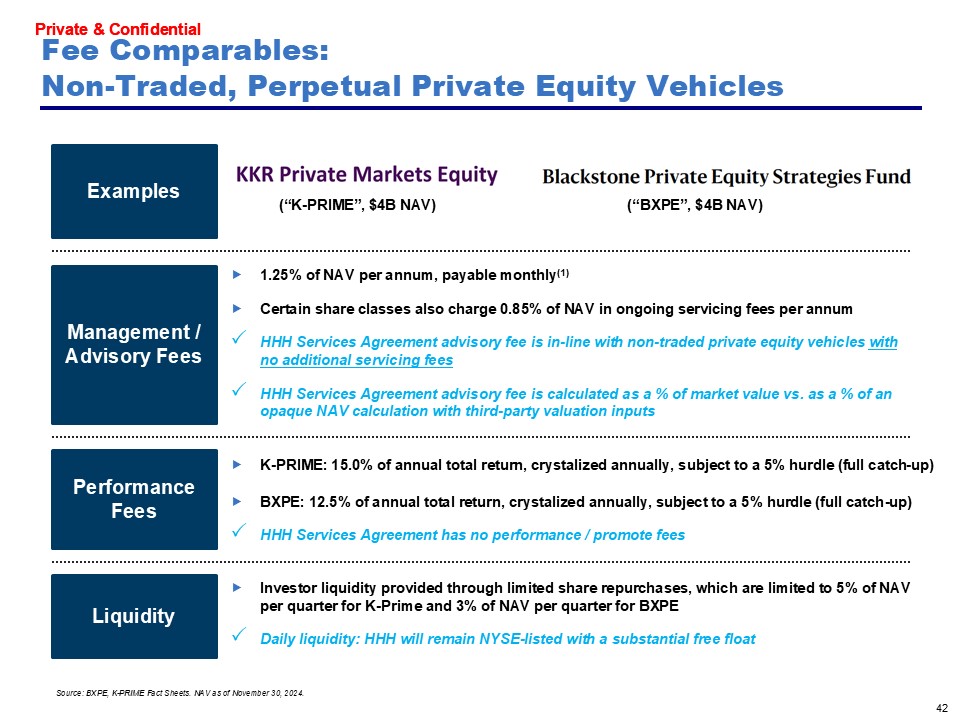
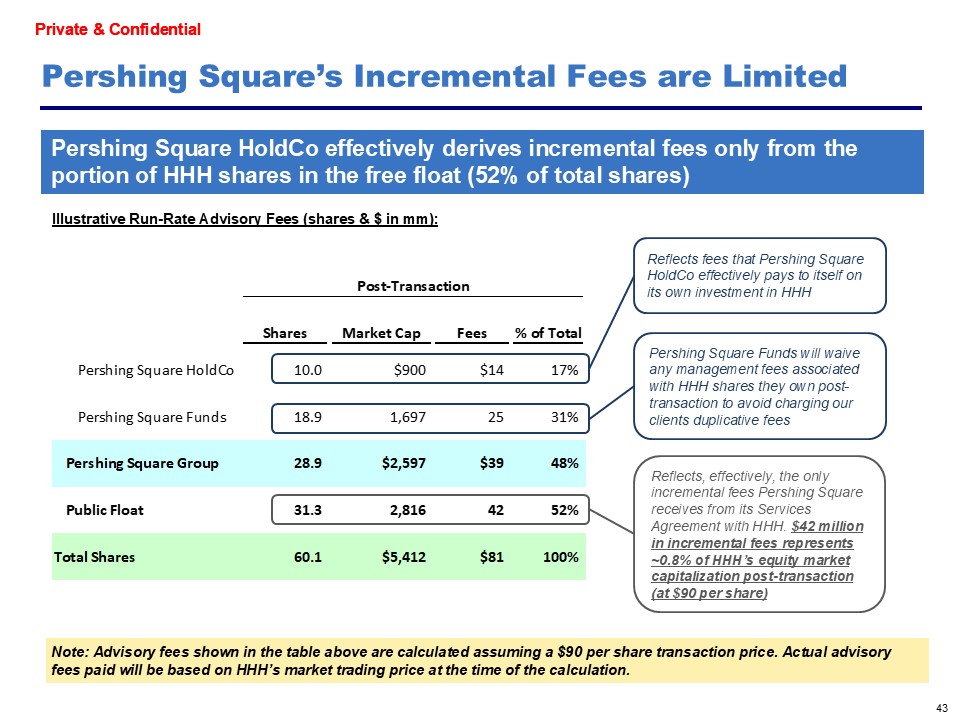
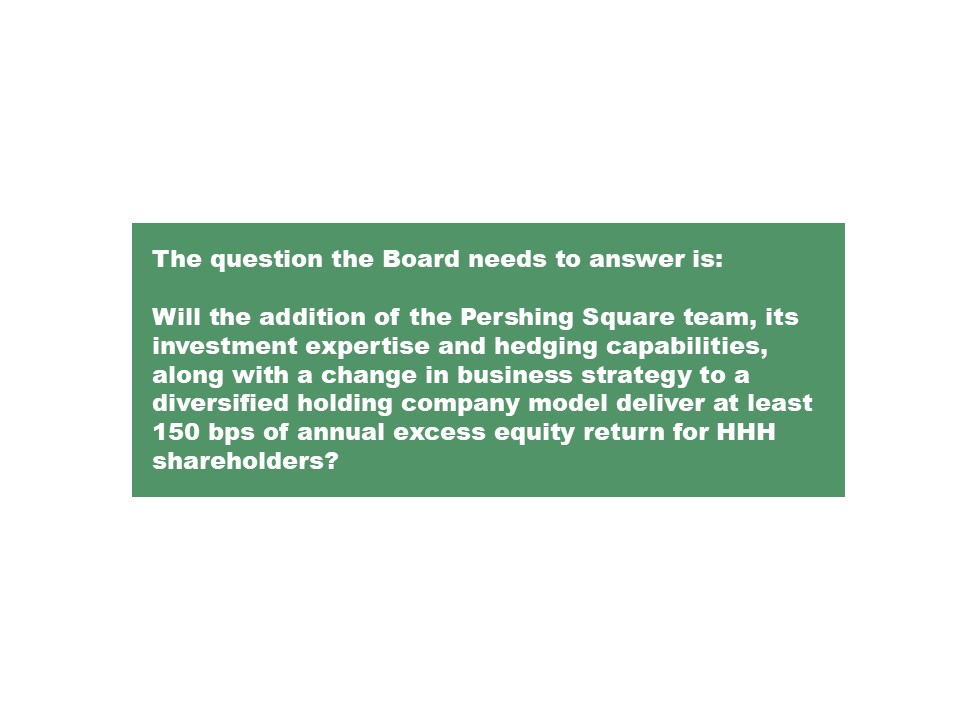
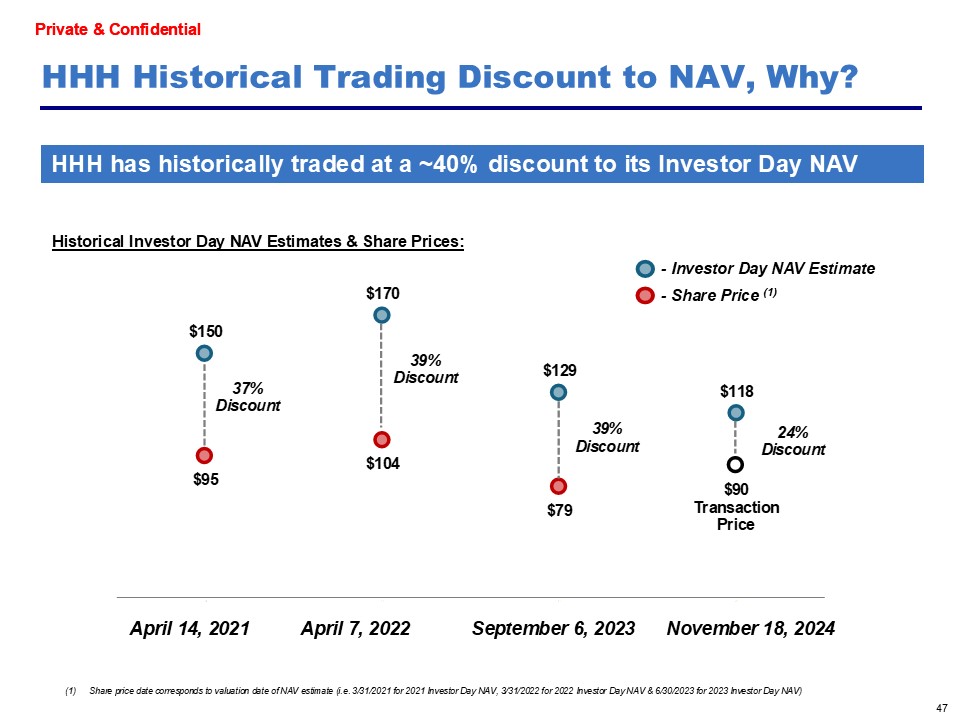
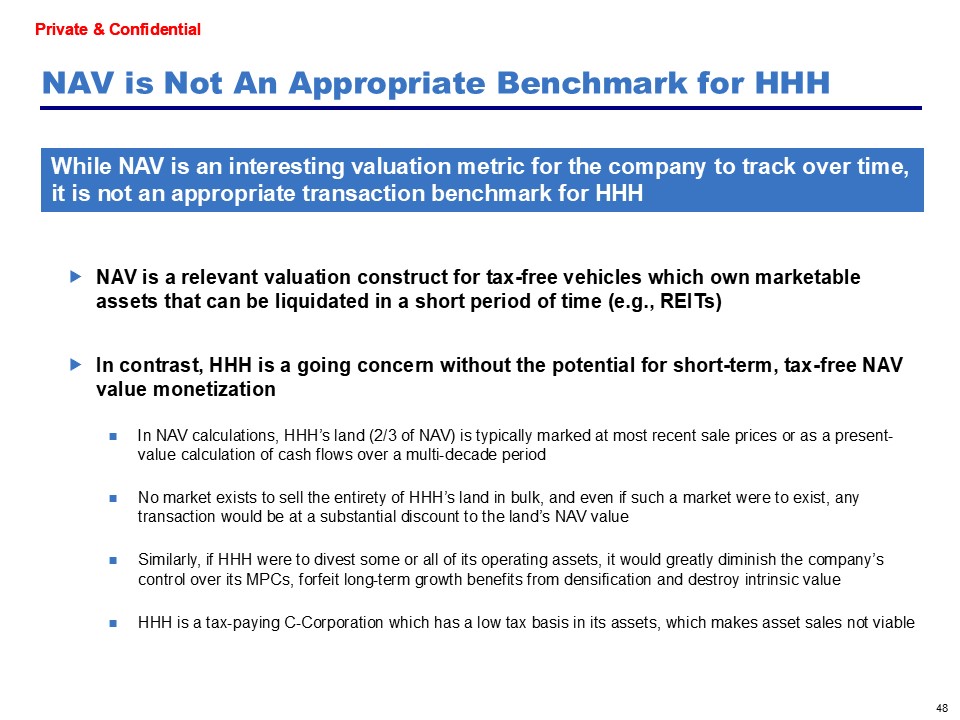
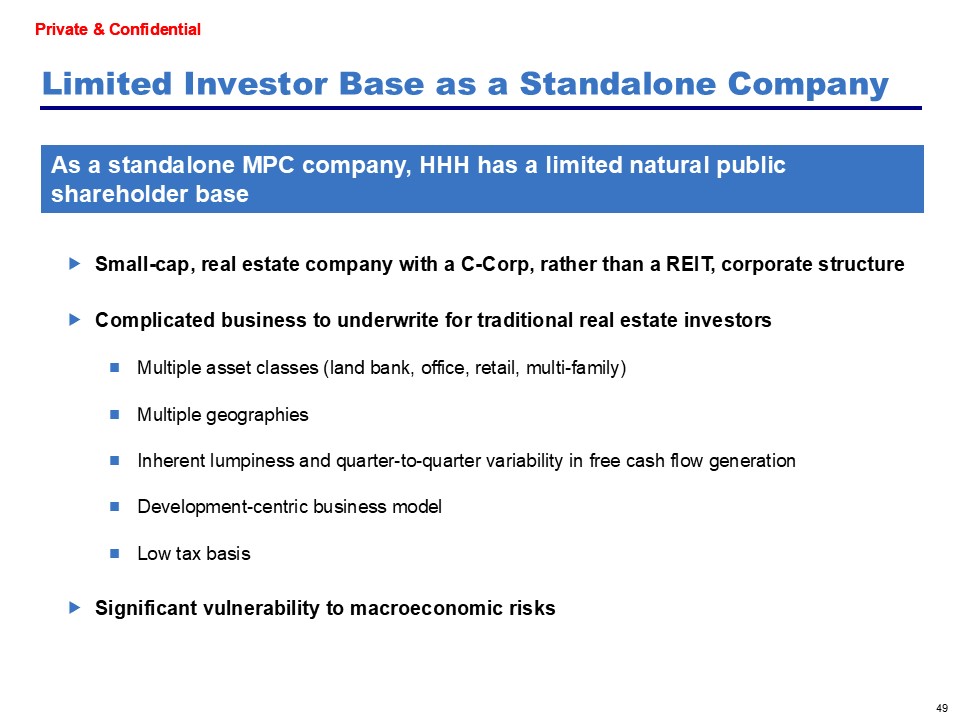
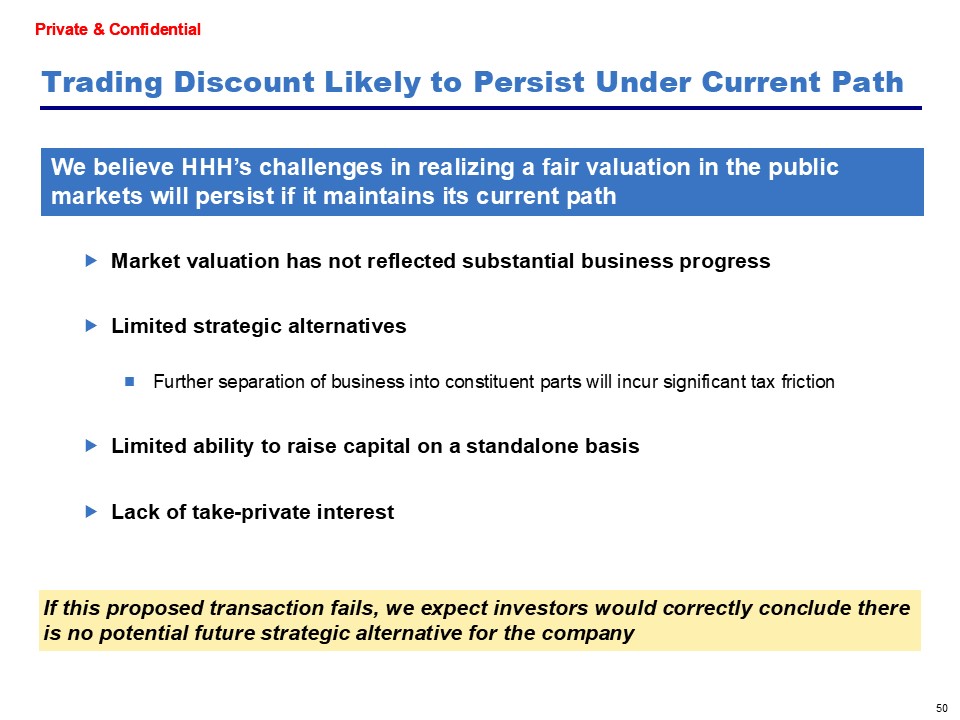
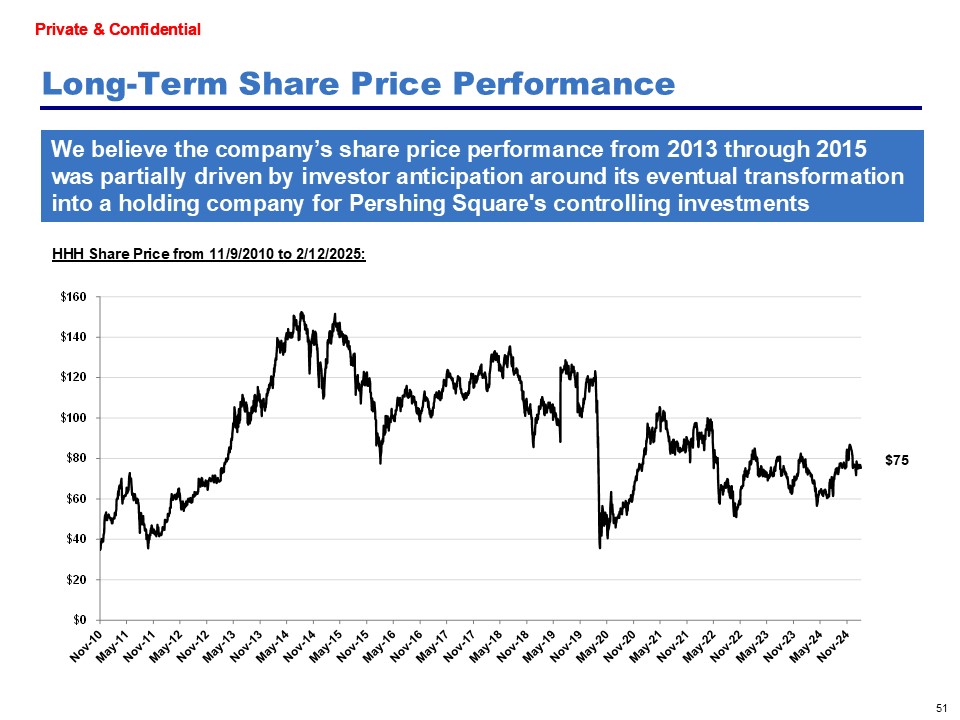
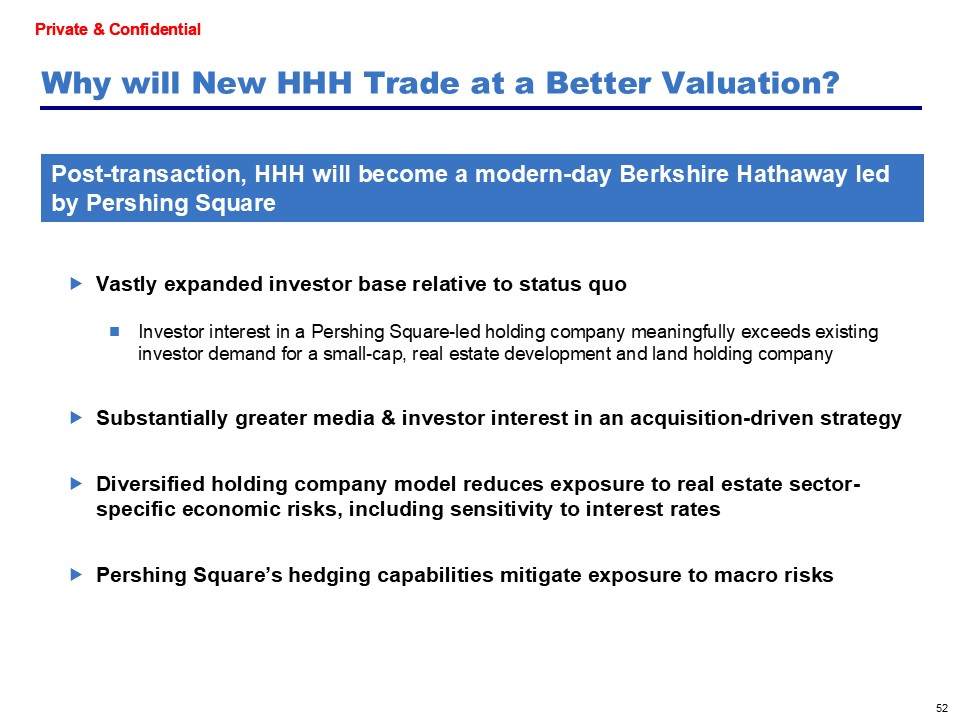

Exhibit 99.24
SCHEDULE I
The name of each member of PS Holdco GP Managing Member, LLC is set forth below.
The business address of each person listed below is c/o PS Holdco GP Managing Member, LLC, 787 Eleventh Avenue, 9th Floor, New York, New York 10019.
Each person is a citizen of the United States of America. The present principal occupation or employment of each of the listed persons is set forth below.
|
NAME
|
PRESENT PRINCIPAL OCCUPATION
|
|
|
William A. Ackman
|
Chairman and Chief Executive Officer of Pershing Square Capital Management, L.P.
|
|
|
Ryan Israel
|
Chief Investment Officer of Pershing Square Capital Management, L.P.
|
|
|
Anthony Massaro
|
Partner of Pershing Square Capital Management, L.P.
|
|
|
Ben Hakim
|
President of Pershing Square Capital Management, L.P.
|
|
|
Michael Gonnella
|
Chief Financial Officer of Pershing Square Capital Management, L.P.
|
|
|
Halit Coussin
|
Chief Legal Officer of Pershing Square Capital Management, L.P.
|
|