


The Howard Hughes Corporation® Reports Second Quarter 2016 Results
DALLAS-- The Howard Hughes Corporation (NYSE:HHC):
Second Quarter Earnings Highlights
- Net income attributable to common stockholders was $7.0 million or $0.16 per diluted common share, compared with income of $50.6 million or $0.18 per diluted share for the second quarter 2015. Second quarter 2016 Adjusted net income increased $43.1 million to $67.3 million, compared to Adjusted net income of $24.2 million for the second quarter of 2015. The increase in Adjusted net income is primarily due to higher earnings from contracted sales at our Waiea and Anaha condominium projects, income growth from our recently completed commercial properties as they continue to stabilize and higher residential land sales. Adjusted net income is net income attributable to common shareholders excluding non-cash warrant (losses) gains and after-tax depreciation and amortization expense.
- Operating Assets Segment EBT increased by $14.2 million to $8.1 million. NOI from our income-producing Operating Assets increased $7.8 million or 27.1%, to $36.3 million for the second quarter 2016, compared to $28.5 million for the second quarter 2015, primarily due to increased NOI from the ongoing stabilization of multiple commercial property developments opened throughout 2015 and early 2016.
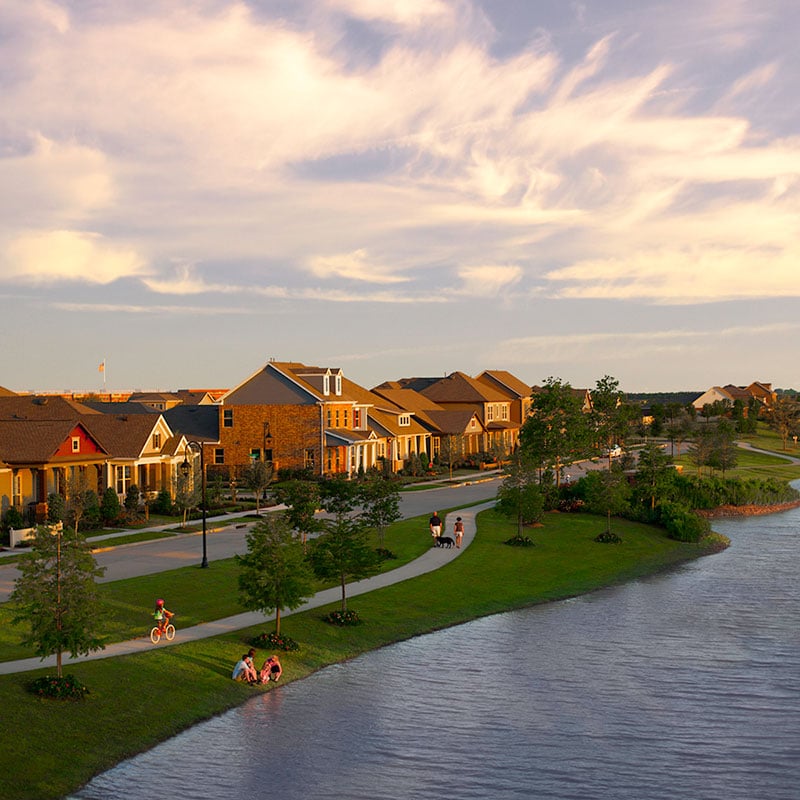
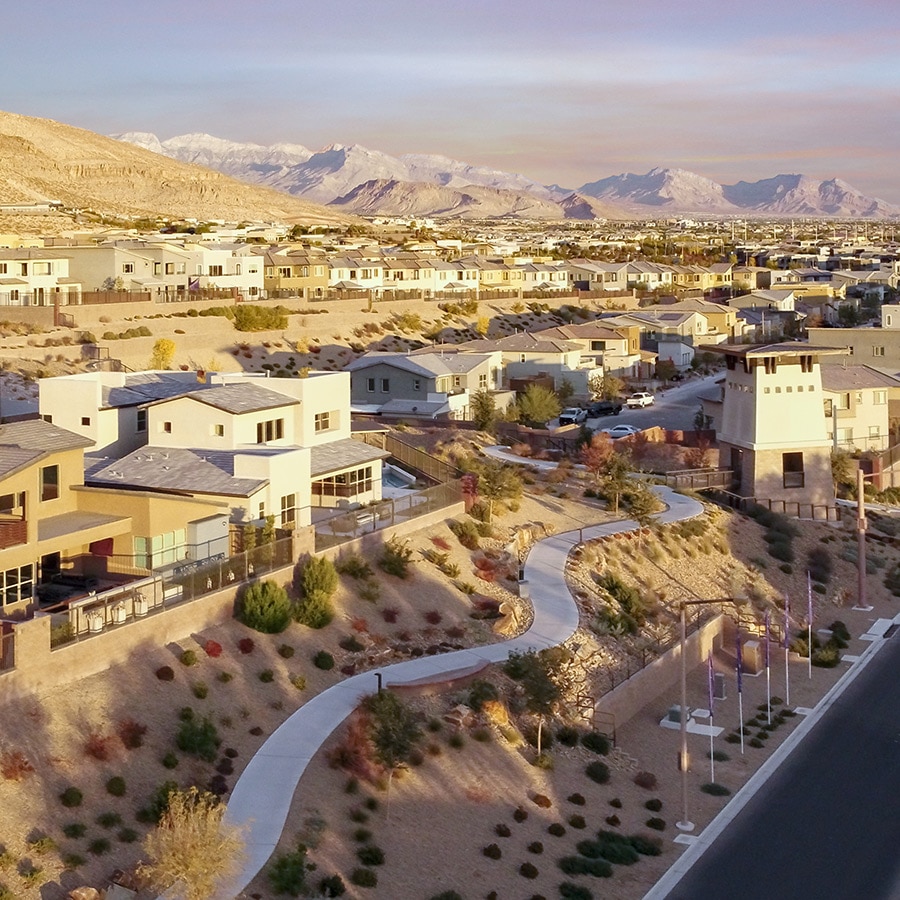
- MPC land sales revenue for the second quarter 2016 was $61.1 million, an increase of $15.7 million compared to land sales revenue of $45.4 million for the second quarter 2015. MPC land sales closed in the second quarter 2016, which excludes deferred revenue and revenue recognized from SID bond transfers, decreased (27.6)% or $(12.9) million, to $33.9 million compared to $46.8 million closed for the second quarter 2015. The decrease in dollar volume of land sale closings during the second quarter 2016 is primarily due to an $(8.3) million and $(7.7) million decrease at Summerlin and The Woodlands, respectively, partially offset by a $3.2 million increase at Bridgeland. The decrease at Summerlin relates to the timing of superpad closings. The housing market at Summerlin remains strong. The Woodlands, which develops and sells lots priced at the upper end of the Houston residential market, continues to experience a slowdown in housing activity due to ongoing economic uncertainty and high levels of homebuilder inventory in its market. At Bridgeland, land sales closings and absorption rates have increased over the prior year period due to stronger demand for more affordable lots.
The Howard Hughes Corporation Property and Financing Highlights
- During the second quarter 2016, closed on $48.2 million in land sales at The Summit, our luxury golf course joint venture development within Summerlin, and recognized $8.9 million in earnings from this venture. As of July 22, 2016, contracted land sales since inception total $177.5 million.
- Pre-leased 57.7% of Two Merriweather, a 130,000-square-foot Class A office building in Downtown Columbia. Construction is scheduled to begin in the third quarter 2016, and we are currently pursuing financing for this project.
- On schedule to complete and close on contracted residential condominium units at Waiea in Ward Village in the fourth quarter this year. 158 of the 174 total units are under contract as of July 13, 2016, representing 90.8% of total units and 85.7% of the total residential square feet available for sale. We continued construction and sales for Anaha, with 292 of the 317 total units under contract, representing 92.1% of total units and 85.4% of the total residential square feet available for sale. Anaha is scheduled to be completed in the summer of 2017.
- Continued construction on Ae‘o, which is the third of the four mixed-use market rate residential towers planned for the first phase of the Ward Village development and expected to be completed by late 2018. Whole Foods Market has pre-leased 80.6% of the retail space in this tower. As of July 13, 2016, 241 of Ae‘o’s 466 total units available for sale are under contract, representing 51.7% of total units and 44.9 % of the total residential square feet available for sale.
- Purchased our joint venture partner’s 18.6% interest in Millennium Woodlands Phase II for $4.0 million on July 20, 2016. Simultaneously with the buyout, we refinanced the joint venture’s existing $37.7 million loan with a $42.5 million fixed rate loan at 3.39% maturing August 1, 2028.
- Recognized $10.5 million in earnings in the second quarter 2016 for our Circle T Ranch and Power Center joint ventures.
*Non-recourse debt means that the debt is non-recourse to The Howard Hughes Corporation but is collateralized by a real estate asset and/or is recourse to the subsidiary entity owning such asset.
The Howard Hughes Corporation® (NYSE:HHC) (the “Company”) today announced its results for the second quarter 2016.
For the three months ended June 30, 2016, net income attributable to common stockholders was $7.0 million or $0.16 per diluted common share, compared with $50.6 million or $0.18 per diluted common share for the same period in 2015. Second quarter 2016 net income attributable to common stockholders includes a non-cash $44.2 million warrant loss and $16.2 million of after-tax depreciation and amortization expense. Excluding these non-cash items, Adjusted net income attributable to common stockholders was $67.3 million or $1.58 per diluted common share. For the second quarter 2015, Adjusted net income attributable to common stockholders was $24.2 million or $0.56 per diluted common share, excluding a $42.6 million non-cash warrant gain and $16.3 million of non-cash after-tax depreciation and amortization expense.
For the six months ended June 30, 2016, net income attributable to common stockholders was $150.7 million or $3.53 per diluted common share, compared with net loss attributable to common stockholders of $(55.4) million or $(1.40) per diluted common share for the same period in 2015. For the six months ended 2016 net income attributable to common stockholders includes a non-cash $14.3 million warrant loss and $31.2 million of after-tax depreciation and amortization expense. Excluding these non-cash items, Adjusted net income attributable to common stockholders was $196.2 million or $4.60 per diluted common share. For the six months ended 2015, Adjusted net income attributable to common stockholders was $41.1 million or $1.04 per diluted common share, excluding a $66.2 million non-cash warrant loss and $30.3 million of non-cash after-tax depreciation and amortization expense.
As we complete and place our developments into service, non-cash depreciation and amortization expense associated with these cash-flowing commercial real estate properties is a more material and growing component of our net income. Adjusted net income is a non-GAAP measure that excludes depreciation and amortization expense and non-cash warrant liability gains and losses. Please see reconciliation of Adjusted Net Income to Net Income (loss) attributable to common stockholders herein..
David R. Weinreb, Chief Executive Officer of The Howard Hughes Corporation, stated, “Significant contributions from each of our three business segments drove strong earnings results this quarter. In particular, residential condominium sales volume at Ward Village continues to demonstrate the desirability of our community and the high quality product that we are developing in Honolulu. NOI from our operating assets is increasing over prior periods as our recently-developed properties stabilize. I am especially pleased that our commercial properties in The Woodlands have continued to generate steady and growing earnings for the company, with no credit issues to date, throughout challenging economic conditions in the overall Houston market.”
Mr. Weinreb continued, “The Summerlin master planned community in Las Vegas remains robust. Summerlin’s results are complemented by the early success and positive momentum in residential lot sales at The Summit, our joint venture with Discovery Land Company, which is developing a luxury golf course community within Summerlin. Furthermore, home sales activity is accelerating at the Bridgeland master planned community in Houston, as the market for moderately-priced housing strengthens. The stronger housing market is consequently driving demand for residential land in this community.”
Business Segment Operating Results
Non-recourse debt means that the debt is non-recourse to The Howard Hughes Corporation, but is collateralized by a real estate asset and/or is recourse to the subsidiary entity owning such asset. All development cost estimates presented herein are exclusive of land costs.
Operating Assets Segment Highlights
NOI from our income-producing Operating Assets are presented in our Supplemental Information to this earnings release. For a reconciliation of Operating Assets NOI to Operating Assets real estate property earnings before taxes (“REP EBT”), Operating Assets REP EBT to GAAP-basis net income (loss) and Adjusted Net Income to Net Income, please refer to the Supplemental Information contained in this earnings release.
Operating assets segment earnings before taxes (EBT) increased $14.2 million to $8.1 million, compared to $(6.0) million for the second quarter 2015.
NOI from our combined retail, office, multi-family and hospitality properties, including our share of NOI from our non-consolidated equity-method ventures (our “income-producing Operating Assets”), increased $7.8 million or 27.1%, to $36.3 million for the second quarter 2016, compared to Adjusted NOI from our income-producing Operating Assets of $28.5 million for the second quarter 2015. These amounts exclude NOI from properties that are substantially closed for redevelopment and properties sold during the periods.
The increase in NOI from income-producing Operating Assets in the second quarter 2016 compared to the second quarter 2015 is primarily driven by increased NOI relating to our Downtown Summerlin and Hughes Landing Retail properties as well as ONE Summerlin and Two Hughes Landing office properties, One Lakes Edge multi-family property and two new hospitality properties, The Westin at The Woodlands and Embassy Suites at Hughes Landing. These increases are offset by decreases in Outlet Collection at Riverwalk due to higher than normal tenant reimbursements in 2015 and expected NOI losses in the current stabilization period of newly-in-service 1725-1735 Hughes Landing while the tenant is in a free-rent period which ends later this year.
Master Planned Communities Segment Highlights
Land sales closed in our MPC segment for the three months ended June 30, 2016 decreased $12.9 million or 27.6% to $33.9 million, compared to $46.8 million for the same period in 2015. Land sales revenue of $61.1 million recognized for three months ended June 30, 2016 included $23.5 million in revenue from closings in prior periods which was previously deferred and that met criteria for recognition in the current quarter. Land sales closed in our MPC segment for the six months ended June 30, 2016 increased $1.6 million or 1.7% to $93.1 million compared to $91.5 million for the same period in 2015. Land sales revenue of $103.0 million recognized for six months ended June 30, 2016 included $6.2 million in revenue from closings in prior periods which was previously deferred and that met criteria for recognition in the current year.
Bridgeland’s land sales for the three and six months ended June 30, 2016 were substantially higher compared to the same periods in 2015 due to increased demand from homebuilders. Although the greater Houston market remains impacted by ongoing economic challenges caused by low oil prices, the Bridgeland MPC is improving compared to prior periods as demand for mid-priced residential housing improved during the second quarter 2016. For the three and six months ended June 30, 2016, Bridgeland sold 12.9 and 24.0 residential acres, respectively, compared to 3.7 and 15.5 acres for the same periods in 2015. The average price per residential acre for single-family – detached product decreased for the three and six months ended June 30, 2016 compared to 2015, by 10.6% and 5.6%, respectively. The decrease is attributable to a slight reduction in our lot pricing to respond to the Bridgeland submarket demand for more moderately priced lots and to the mix of lot sizes that were sold in the respective periods. For the three and six months ended June 30, 2016, there were a larger percentage of smaller, lower-priced lots sold than in the same periods in 2015. There were 100 and 170 new home sales at Bridgeland for the three and six months ended June 30, 2016, representing an increase of 63.9% and 57.4%, respectively, compared to the same periods in 2015. For the three months ended June 30, 2016, the median price of new homes sold in Bridgeland was $316,000, a 23.9% decrease compared to $415,000 for the same period in 2015. The median price of new homes sold in the six months ended June 30, 2016 decreased 20.3% to $329,000 compared to $413,000 for the same period in 2015.
Summerlin’s land sales for the three months ended June 30, 2016 were lower compared to the same period in 2015 because second quarter 2015 included the sale of a high-end superpad in The Ridges, Summerlin’s exclusive gated community. The average price per superpad acre sold for the three months ended June 30, 2016 was $505,000 compared to $563,000 for the same period in 2015, a reduction of 10.3% primarily due to this superpad sale. Summerlin’s land sales for the six months ended June 30, 2016 were higher compared to the same period in 2015 primarily due to a $40 million bulk sale to a homebuilder for a large parcel in the first quarter 2016. This sale was unique as the homebuilder will be responsible for installing roads, utilities and drainage facilities to the village, and Summerlin is not obligated to incur any development costs within the boundaries of the parcel. The Summerlin market remains strong. Summerlin had 201 and 350 new home sales for the three and six months ended June 30, 2016, respectively, representing a 9.8% and 7.0% increase compared to 183 and 327 new home sales for the three and six months ended June 30, 2015, respectively. For the three months ended June 30, 2016, the median price of new homes sold in Summerlin increased 0.2% to $538,000 compared to $537,000 for the same period in 2015. The median price of new homes sold in Summerlin increased 1.7% to $544,000 for the six months ended June 30, 2016 compared to $535,000 for the same period in 2015.
Land development at The Summit, our joint venture with Discovery Land, continues to progress on schedule. For the three months ended June 30, 2016, 17 custom residential lots have been sold, and we recognized $8.9 million of earnings from this venture in the second quarter 2016 compared to no earnings in the second quarter 2015.
The Woodlands total residential land sales for the three and six months ended June 30, 2016 decreased to 2.3 and 6.4 acres, respectively, compared to 12.2 and 22.8 acres for the same periods in 2015. The average price per residential acre for single-family - detached product increased 4.3% for the three months ended June 30, 2016 and decreased 4.4% for the six months ended June 30, 2016 compared to the same periods in 2015, respectively, primarily due to the mix of lots sold. The decrease in acreage sold for the three and six months ended June 30, 2016 compared to the same periods in 2015 is attributable to homebuilder caution on expanding their land inventory given the continued slow absorption of higher-priced lots and homes, reduced demand for new homes and increased builder lot inventory. The economic uncertainty in The Woodlands submarket is driven by continued low oil prices and declining job growth. There were 61 and 117 new home sales in The Woodlands for the three and six months ended June 30, 2016, respectively, representing a 26.5% and 29.9% decrease compared to the 83 and 167 new home sales for the same periods in 2015. For the three months ended June 30, 2016, the median price of new homes sold in The Woodlands decreased 4.1% to $559,000 compared to $583,000 for the same period in 2015. The median price of new homes sold in the six months ended June 30, 2016 increased 0.5% to $553,000 compared to $550,000 for the same period in 2015.
Strategic Developments Segment Highlights
The increase in condominium rights and unit sales for the second quarter 2016 as compared to the same period in 2015 is primarily due to revenue recognition at our Anaha condominium project for which we began recognizing revenue in the second quarter 2015. Waiea and Anaha continue to advance towards completion resulting in additional revenue recognition under the percentage of completion method of accounting.
Waiea has 174 total units, of which 90.8% have been contracted as of July 13, 2016. These contracted sales represent 85.7% of the total residential square feet available for sale. Total development costs are expected to be approximately $403 million, and as of June 30, 2016, we have incurred $303.5 million of development costs. We expect to complete the project by the end of 2016.
Anaha has 317 total units, of which 92.1% have been contracted as of July 13, 2016. These contracted sales represent 85.4% of the total residential square feet available for sale. Total development costs are expected to be approximately $401 million, and as of June 30, 2016, we have incurred $170.2 million of development costs. We expect to complete the tower in the second quarter of 2017.
Construction of Ae‘o and the flagship Whole Foods Market, located on the same block, began in February 2016, with completion scheduled in late 2018. Pre-sales are ongoing, and as of July 13, 2016, 51.7% of the 466 total units available for sale were under contract, representing 44.9% of the total residential square feet available for sale. Total development costs are expected to be approximately $430 million, and we have incurred $39.2 million of development costs as of June 30, 2016. To date, we have not met all the necessary requirements to begin recognizing revenue on the percentage of completion method.
In March 2016, we received approval from the Hawai‘i Real Estate Commission to market the sale of our workforce residential tower, Ke Kilohana. The tower will consist of 424 residences, 375 of which are offered to local residents of Hawai‘i who meet certain maximum income and net worth requirements. Pre-sales on the workforce units began in the first quarter 2016 and 100% of the units are under contract as of June 30, 2016. The market rate units began public pre-sales in late July 2016. Total development costs are expected to be approximately $219 million, and as of June 30, 2016, we have incurred $10.5 million of pre-development costs on this project.
We began construction of One Merriweather, a Class A office building and the adjacent garage, during the fourth quarter 2015 and anticipate completion of the project in the fourth quarter 2016. Total estimated development costs are approximately $78 million, inclusive of approximately $15 million of construction costs related to the parking garage. As of June 30, 2016, we have incurred $37.0 million of development costs. As of July 13, 2016, 49.0% of the building is pre-leased to MedStar Health, the largest healthcare provider in the region.
We expect to begin construction of Two Merriweather, a Class A mixed-use office building, in the third quarter 2016. Two Merriweather will consist of 100,000 square feet of office and 30,000 square feet of retail space. Total estimated development costs are approximately $41 million. As of June 30, 2016, we have incurred $0.6 million of development costs. As of July 13, 2016, 57.7% of the total project and 75.0% of the office space is pre-leased. We are currently seeking financing for this project.
In the first quarter 2016, our m.flats joint venture with Kettler located in Downtown Columbia began construction on a 437-unit, Class A multi-family project with 29,000 square feet of ground floor retail. We anticipate the first units will be available for rent in the first quarter 2017. Total development costs are expected to be approximately $108 million, of which the venture had incurred $17.2 million as of June 30, 2016. We contributed $2.4 million in the three months ended June 30, 2016 and we are required to fund an additional $3.9 million into this joint venture.
For a more complete description of the status of our developments, please refer to “Item 2 - Management’s Discussion and Analysis of Financial Condition and Results of Operations” beginning on page 30 of our Form 10-Q for the three and six months ended June 30, 2016.
About The Howard Hughes Corporation®
The Howard Hughes Corporation owns, manages and develops commercial, residential and mixed-use real estate throughout the U.S. Our properties include master planned communities, operating properties, development opportunities and other unique assets spanning 16 states from New York to Hawai‘i. The Howard Hughes Corporation is traded on the New York Stock Exchange under HHC with major offices in New York, Columbia, MD, Dallas, Houston, Las Vegas and Honolulu. For additional information about HHC, visit www.howardhughes.com, or find us on Facebook, Twitter, Instagram, and LinkedIn.
Safe Harbor Statement
Statements made in this press release that are not historical facts, including statements accompanied by words such as “will,” “believe,” “expect,” “enables,” “realize,” “plan,” “intend,” “assume,” “transform” and other words of similar expression, are forward-looking statements within the meaning of the Private Securities Litigation Reform Act of 1995. These statements are based on management’s expectations, estimates, assumptions, and projections as of the date of this release and are not guarantees of future performance. Actual results may differ materially from those expressed or implied in these statements. Factors that could cause actual results to differ materially are set forth as risk factors in The Howard Hughes Corporation’s filings with the Securities and Exchange Commission, including its Quarterly and Annual Reports. The Howard Hughes Corporation cautions you not to place undue reliance on the forward-looking statements contained in this release. The Howard Hughes Corporation does not undertake any obligation to publicly update or revise any forward-looking statements to reflect future events, information or circumstances that arise after the date of this release.
|
THE HOWARD HUGHES CORPORATION |
|||||||||||||||||
| CONDENSED CONSOLIDATED STATEMENTS OF OPERATIONS | |||||||||||||||||
| UNAUDITED | |||||||||||||||||
| Three Months Ended June 30, | Six Months Ended June 30, | ||||||||||||||||
| (In thousands, except per share amounts) | 2016 | 2015 | 2016 | 2015 | |||||||||||||
| Revenues: | |||||||||||||||||
| Condominium rights and unit sales | $ | 125,112 | $ | 86,513 | $ | 247,206 | $ | 121,370 | |||||||||
| Master Planned Community land sales | 61,098 | 45,433 | 103,040 | 93,514 | |||||||||||||
| Minimum rents | 42,036 | 36,989 | 83,345 | 72,183 | |||||||||||||
| Builder price participation | 6,501 | 7,907 | 11,148 | 13,605 | |||||||||||||
| Tenant recoveries | 10,923 | 10,701 | 21,451 | 20,368 | |||||||||||||
| Hospitality revenues | 19,129 | 11,481 | 32,038 | 23,484 | |||||||||||||
| Other land revenues | 2,759 | 3,145 | 5,792 | 6,438 | |||||||||||||
| Other rental and property revenues | 4,593 | 6,994 | 7,797 | 13,291 | |||||||||||||
| Total revenues | 272,151 | 209,163 | 511,817 | 364,253 | |||||||||||||
| Expenses and other income: | |||||||||||||||||
| Condominium rights and unit cost of sales | 79,726 | 56,765 | 154,541 | 79,174 | |||||||||||||
| Master Planned Community cost of sales | 29,008 | 24,236 | 44,696 | 48,132 | |||||||||||||
| Master Planned Community operations | 7,806 | 11,963 | 17,400 | 21,946 | |||||||||||||
| Other property operating costs | 15,236 | 19,634 | 30,978 | 37,779 | |||||||||||||
| Rental property real estate taxes | 7,329 | 6,568 | 14,077 | 12,768 | |||||||||||||
| Rental property maintenance costs | 2,753 | 2,900 | 5,885 | 5,644 | |||||||||||||
| Hospitality costs | 14,242 | 8,893 | 24,717 | 17,971 | |||||||||||||
| Provision for doubtful accounts | (352 | ) | 1,266 | 2,689 | 2,075 | ||||||||||||
| Demolition costs | 490 | 1,496 | 962 | 1,613 | |||||||||||||
| Development-related marketing costs | 6,339 | 5,594 | 10,870 | 11,837 | |||||||||||||
| General and administrative | 20,053 | 19,606 | 40,377 | 38,569 | |||||||||||||
| Other income, net | (9,067 | ) | (399 | ) | (9,426 | ) | (1,863 | ) | |||||||||
| Gain on sale of 80 South Street Assemblage | — | — | (140,479 | ) | — | ||||||||||||
| Depreciation and amortization | 24,952 | 25,069 | 47,924 | 46,579 | |||||||||||||
| Total expenses, net of other income | 198,515 | 183,591 | 245,211 | 322,224 | |||||||||||||
| Operating income | 73,636 | 25,572 | 266,606 | 42,029 | |||||||||||||
| Interest income | 435 | 271 | 704 | 407 | |||||||||||||
| Interest expense | (16,533 | ) | (14,685 | ) | (32,526 | ) | (27,931 | ) | |||||||||
| Warrant liability (loss) gain | (44,150 | ) | 42,620 | (14,330 | ) | (66,190 | ) | ||||||||||
| Equity in earnings from Real Estate and Other Affiliates | 20,275 | 1,081 | 22,207 | 2,869 | |||||||||||||
| Income (loss) before taxes | 33,663 | 54,859 | 242,661 | (48,816 | ) | ||||||||||||
| Provision for income taxes | 26,693 | 4,274 | 91,926 | 6,558 | |||||||||||||
| Net income (loss) | 6,970 | 50,585 | 150,735 | (55,374 | ) | ||||||||||||
| Net income attributable to noncontrolling interests | — | (12 | ) | — | (12 | ) | |||||||||||
| Net income (loss) attributable to common stockholders | $ | 6,970 | $ | 50,573 | $ | 150,735 | $ | (55,386 | ) | ||||||||
| Basic income (loss) per share: | $ | 0.18 | $ | 1.28 | $ | 3.82 | $ | (1.40 | ) | ||||||||
| Diluted income (loss) per share: | $ | 0.16 | $ | 0.18 | $ | 3.53 | $ | (1.40 | ) | ||||||||
| THE HOWARD HUGHES CORPORATION | |||||||||
| CONDENSED CONSOLIDATED BALANCE SHEETS | |||||||||
| UNAUDITED | |||||||||
| June 30, | December 31, | ||||||||
| (In thousands, except share amounts) | 2016 | 2015 | |||||||
| Assets: | |||||||||
| Investment in real estate: | |||||||||
| Master Planned Community assets | $ | 1,652,056 | $ | 1,642,842 | |||||
| Land | 315,617 | 322,462 | |||||||
| Buildings and equipment | 1,910,016 | 1,772,401 | |||||||
| Less: accumulated depreciation | (271,451 | ) | (232,969 | ) | |||||
| Developments | 915,157 | 1,036,927 | |||||||
| Net property and equipment | 4,521,395 | 4,541,663 | |||||||
| Investment in Real Estate and Other Affiliates | 65,834 | 57,811 | |||||||
| Net investment in real estate | 4,587,229 | 4,599,474 | |||||||
| Cash and cash equivalents | 670,800 | 445,301 | |||||||
| Accounts receivable, net | 40,152 | 32,203 | |||||||
| Municipal Utility District receivables, net | 163,639 | 139,946 | |||||||
| Notes receivable, net | 69 | 1,664 | |||||||
| Deferred expenses, net | 63,099 | 61,804 | |||||||
| Prepaid expenses and other assets, net | 692,631 | 441,190 | |||||||
| Total assets | $ | 6,217,619 | $ | 5,721,582 | |||||
|
|
|||||||||
| Liabilities: | |||||||||
| Mortgages, notes and loans payable | $ | 2,651,805 | $ | 2,443,962 | |||||
| Deferred tax liabilities | 158,177 | 89,221 | |||||||
| Warrant liabilities | 322,090 | 307,760 | |||||||
| Uncertain tax position liability | 9,588 | 1,396 | |||||||
| Accounts payable and accrued expenses | 572,772 | 515,354 | |||||||
| Total liabilities | 3,714,432 | 3,357,693 | |||||||
| Equity: | |||||||||
| Preferred stock: $.01 par value; 50,000,000 shares authorized, none issued | — | — | |||||||
| Common stock: $.01 par value; 150,000,000 shares authorized, 39,846,036 shares issued and 39,833,975 outstanding as of June 30, 2016 and 39,714,838 shares issued and outstanding as of December 31, 2015 | 398 | 398 | |||||||
| Additional paid-in capital | 2,853,880 | 2,847,823 | |||||||
| Accumulated deficit | (329,480 | ) | (480,215 | ) | |||||
| Accumulated other comprehensive loss | (24,152 | ) | (7,889 | ) | |||||
| Treasury stock, at cost, 12,061 shares as of June 30, 2016 and 0 shares as of December 31, 2015 | (1,231 | ) | — | ||||||
| Total stockholders' equity | 2,499,415 | 2,360,117 | |||||||
| Noncontrolling interests | 3,772 | 3,772 | |||||||
| Total equity | 2,503,187 | 2,363,889 | |||||||
| Total liabilities and equity | $ | 6,217,619 | $ | 5,721,582 | |||||
Supplemental Information
June 30, 2016
As our three segments, Master Planned Communities, Operating Assets and Strategic Developments, are managed separately, we use different operating measures to assess operating results and allocate resources among these three segments. The one common operating measure used to assess operating results for our business segments is real estate property earnings before taxes (“REP EBT”). REP EBT, as it relates to our business, is defined as net income (loss) excluding general and administrative expenses, corporate interest income and corporate interest and depreciation expense, provision for income taxes, warrant liability gain (loss), other income, and gains on sales relating to operating properties. We present REP EBT because we use this measure, among others, internally to assess the core operating performance of our assets. However, REP EBT should not be considered as an alternative to GAAP net income (loss).
| Reconciliation of REP EBT to GAAP income (loss) before taxes | Three Months Ended June 30, | Six Months Ended June 30, | |||||||||||||||
| (In thousands) | 2016 | 2015 | 2016 | 2015 | |||||||||||||
| REP EBT | $ | 106,170 | $ | 46,171 | $ | 320,023 | $ | 83,985 | |||||||||
| General and administrative | (20,053 | ) | (19,606 | ) | (40,377 | ) | (38,569 | ) | |||||||||
| Corporate interest expense, net | (13,023 | ) | (13,235 | ) | (26,097 | ) | (26,447 | ) | |||||||||
| Warrant liability gain (loss) | (44,150 | ) | 42,620 | (14,330 | ) | (66,190 | ) | ||||||||||
| Corporate other income, net | 6,317 | 396 | 6,069 | 1,529 | |||||||||||||
| Corporate depreciation and amortization | (1,598 | ) | (1,487 | ) | (2,627 | ) | (3,124 | ) | |||||||||
| Income (loss) before taxes | $ | 33,663 | $ | 54,859 | $ | 242,661 | $ | (48,816 | ) | ||||||||
We also adjust GAAP net income (loss) for non-cash warrant liability gains and losses and depreciation and amortization. The presentation of Adjusted net income is consistent with other companies in the real estate business who also typically report an earnings measure that excludes depreciation and amortization and other non-operating related items.
| Reconciliation of Adjusted net income to Net income | Three Months Ended June 30, | Six Months Ended June 30, | |||||||||||||||
| (loss) attributable to common stockholders | 2016 | 2015 | 2016 | 2015 | |||||||||||||
| (In thousands) | |||||||||||||||||
| Adjusted Net Income | $ | 67,339 | $ | 24,248 | $ | 196,216 | $ | 41,080 | |||||||||
| Depreciation and amortization, net of tax | (16,219 | ) | (16,295 | ) | (31,151 | ) | (30,276 | ) | |||||||||
| Warrant liability gain (loss) | (44,150 | ) | 42,620 | (14,330 | ) | (66,190 | ) | ||||||||||
| Net income (loss) attributable to common stockholders | $ | 6,970 | $ | 50,573 | $ | 150,735 | $ | (55,386 | ) | ||||||||
|
Summary of MPC Land Sales Closed in the Three Months Ended June 30, |
||||||||||||||||||||||||||||||||
| Land Sales | Acres Sold | Number of Lots/Units | Price per acre | Price per lot | ||||||||||||||||||||||||||||
| ($ In thousands) | 2016 | 2015 | 2016 | 2015 | 2016 | 2015 | 2016 | 2015 | 2016 | 2015 | ||||||||||||||||||||||
| Bridgeland | ||||||||||||||||||||||||||||||||
| Residential | ||||||||||||||||||||||||||||||||
| Single family - detached | $ | 4,656 | $ | 1,495 | 12.9 | 3.7 | 68 | 19 | $ | 361 | $ | 404 | $ | 68 | $ | 79 | ||||||||||||||||
| Total | 4,656 | 1,495 | 12.9 | 3.7 | 68 | 19 | 361 | 404 | 68 | 79 | ||||||||||||||||||||||
|
$ Change |
3,161 | 9.2 | 49 | (43 | ) | (11 | ) | |||||||||||||||||||||||||
|
% Change |
211.4 | % | 248.6 | % | 257.9 | % | (10.6 | %) | (13.9 | %) | ||||||||||||||||||||||
| Maryland Communities | ||||||||||||||||||||||||||||||||
| No land sales | ||||||||||||||||||||||||||||||||
| Summerlin | ||||||||||||||||||||||||||||||||
| Residential | ||||||||||||||||||||||||||||||||
| Superpad sites | 26,987 | 29,256 | 53.4 | 52.0 | 316 | 155 | 505 | 563 | 85 | 189 | ||||||||||||||||||||||
| Custom lots | 505 | 3,775 | 0.3 | 2.5 | 1 | 6 | 1,683 | 1,510 | 505 | 629 | ||||||||||||||||||||||
| Commercial | ||||||||||||||||||||||||||||||||
| Not-for-profit | 348 | — | 10.0 | — | — | — | 35 | — | — | — | ||||||||||||||||||||||
| Other | — | 3,136 | — | 3.6 | — | — | — | 871 | — | — | ||||||||||||||||||||||
| Total | 27,840 | 36,167 | 63.7 | 58.1 | 317 | 161 | 437 | 622 | 87 | 205 | ||||||||||||||||||||||
|
$ Change |
(8,327 | ) | 5.6 | 156 | (185 | ) | (118 | ) | ||||||||||||||||||||||||
|
% Change |
(23.0 | %) | 9.6 | % | 96.9 | % | (29.7 | %) | (57.6 | %) | ||||||||||||||||||||||
| The Woodlands | ||||||||||||||||||||||||||||||||
| Residential | ||||||||||||||||||||||||||||||||
| Single family - detached | 1,386 | 7,052 | 2.3 | 12.2 | 9 | 43 | 603 | 578 | 154 | 164 | ||||||||||||||||||||||
| Commercial | ||||||||||||||||||||||||||||||||
| Not-for-profit | — | 733 | — | 5.0 | — | — | — | 147 | — | — | ||||||||||||||||||||||
| Other | — | 1,321 | — | 0.9 | — | — | — | 1,468 | — | — | ||||||||||||||||||||||
| Total | 1,386 | 9,106 | 2.3 | 18.1 | 9 | 43 | 603 | 503 | 154 | 164 | ||||||||||||||||||||||
|
$ Change |
(7,720 | ) | (15.8 | ) | (34 | ) | 100 | (10 | ) | |||||||||||||||||||||||
|
% Change |
(84.8 | %) | (87.3 | %) | (79.1 | %) | 19.9 | % | (6.1 | %) | ||||||||||||||||||||||
| Total acreage sales closed in period | $ | 33,882 | $ | 46,768 | 78.9 | 79.9 | 394 | 223 | ||||||||||||||||||||||||
| Net recognized (deferred) revenue | ||||||||||||||||||||||||||||||||
| Bridgeland | $ | (156 | ) | $ | — | |||||||||||||||||||||||||||
| Summerlin | 23,671 | (2,500 | ) | |||||||||||||||||||||||||||||
| Total net recognized (deferred) revenue (a) | 23,515 | (2,500 | ) | |||||||||||||||||||||||||||||
| Special Improvement District revenue | 3,701 | 1,165 | ||||||||||||||||||||||||||||||
| Total segment land sales revenue - GAAP basis | $ | 61,098 | $ | 45,433 | ||||||||||||||||||||||||||||
|
(a) Represents additional revenues recognized currently on sales closed in prior periods where revenue was deferred, net of amounts deferred on sales closed in the current period. |
||||||||
|
Summary of MPC Land Sales Closed in the Six Months Ended June 30, |
||||||||||||||||||||||||||||||||
| Land Sales | Acres Sold | Number of Lots/Units | Price per acre | Price per lot | ||||||||||||||||||||||||||||
| ($ In thousands) | 2016 | 2015 | 2016 | 2015 | 2016 | 2015 | 2016 | 2015 | 2016 | 2015 | ||||||||||||||||||||||
| Bridgeland | ||||||||||||||||||||||||||||||||
| Residential | ||||||||||||||||||||||||||||||||
| Single family - detached | $ | 8,870 | $ | 6,073 | 24.0 | 15.5 | 132 | 60 | $ | 370 | $ | 392 | $ | 67 | $ | 101 | ||||||||||||||||
| Total | 8,870 | 6,073 | 24.0 | 15.5 | 132 | 60 | 370 | 392 | 67 | 101 | ||||||||||||||||||||||
|
$ Change |
2,797 | 8.5 | 72 | (22 | ) | (34 | ) | |||||||||||||||||||||||||
|
% Change |
46.1 | % | 54.8 | % | 120.0 | % | (5.6 | %) | (33.7 | %) | ||||||||||||||||||||||
| Maryland Communities | ||||||||||||||||||||||||||||||||
| No land sales | ||||||||||||||||||||||||||||||||
| Summerlin | ||||||||||||||||||||||||||||||||
| Residential | ||||||||||||||||||||||||||||||||
| Superpad sites | 66,987 | 46,030 | 170.2 | 81.2 | 868 | 233 | 394 | (a) | 567 | 77 | 198 | |||||||||||||||||||||
| Single family - detached | — | 13,650 | — | 14.9 | — | 75 | — | 916 | — | 182 | ||||||||||||||||||||||
| Custom lots | 2,645 | 6,320 | 1.6 | 4.5 | 5 | 11 | 1,653 | 1,404 | 529 | 575 | ||||||||||||||||||||||
| Commercial | ||||||||||||||||||||||||||||||||
| Not-for-profit | 348 | — | 10.0 | — | — | — | 35 | — | — | — | ||||||||||||||||||||||
| Other | — | 3,136 | — | 3.6 | — | — | — | 871 | — | — | ||||||||||||||||||||||
| Total | 69,980 | 69,136 | 181.8 | 104.2 | 873 | 319 | 385 | 663 | 80 | 207 | ||||||||||||||||||||||
|
$ Change |
844 | 77.6 | 554 | (278 | ) | (127 | ) | |||||||||||||||||||||||||
|
% Change |
1.2 | % | 74.5 | % | 173.7 | % | (41.9 | %) | (61.4 | %) | ||||||||||||||||||||||
| The Woodlands | ||||||||||||||||||||||||||||||||
| Residential | ||||||||||||||||||||||||||||||||
| Single family - detached | 3,850 | 13,859 | 6.4 | 22.0 | 26 | 80 | 602 | 630 | 148 | 173 | ||||||||||||||||||||||
| Single family - attached | — | 408 | — | 0.8 | — | 9 | — | 510 | — | 45 | ||||||||||||||||||||||
| Commercial | ||||||||||||||||||||||||||||||||
| Not-for-profit | — | 733 | — | 5.0 | — | — | — | 147 | — | |||||||||||||||||||||||
| Medical | 10,405 | — | 4.3 | — | — | — | 2,420 | — | — | — | ||||||||||||||||||||||
| Other | — | 1,321 | — | 0.9 | — | — | — | 1,468 | — | — | ||||||||||||||||||||||
| Total | 14,255 | 16,321 | 10.7 | 28.7 | 26 | 89 | 1,332 | 569 | 148 | 160 | ||||||||||||||||||||||
|
$ Change |
(2,066 | ) | (18.0 | ) | (63 | ) | 763 | (12 | ) | |||||||||||||||||||||||
|
% Change |
(12.7 | %) | (62.7 | %) | (70.8 | %) | 134.1 | % | (7.5 | %) | ||||||||||||||||||||||
| Total acreage sales closed in period | $ | 93,105 | $ | 91,530 | 216.5 | 148.4 | 1,031 | 468 | ||||||||||||||||||||||||
| Net recognized (deferred) revenue | ||||||||||||||||||||||||||||||||
| Bridgeland | $ | (88 | ) | $ | — | |||||||||||||||||||||||||||
| Summerlin | 6,291 | (2,107 | ) | |||||||||||||||||||||||||||||
| Total net recognized (deferred) revenue (b) | 6,203 | (2,107 | ) | |||||||||||||||||||||||||||||
| Special Improvement District revenue | 3,732 | 4,091 | ||||||||||||||||||||||||||||||
| Total segment land sales revenue - GAAP basis | $ | 103,040 | $ | 93,514 | ||||||||||||||||||||||||||||
|
(a) Please see discussion in “Master Planned Communities Segment Highlights” section above. |
||||||
|
(b) Represents additional revenues recognized currently on sales closed in prior periods where revenue was deferred, net of amounts deferred on sales closed in the current period. |
||||||
Operating Assets Net Operating Income
The Company believes that NOI is a useful supplemental measure of the performance of our Operating Assets because it provides a performance measure that, when compared year-over-year, reflects the revenues and expenses directly associated with owning and operating real estate properties and the impact on operations from trends in occupancy rates, rental rates, and operating costs. We define NOI as revenues (rental income, tenant recoveries and other income) less expenses (real estate taxes, repairs and maintenance, marketing and other property expenses). NOI also excludes straight line rents and tenant incentives amortization, net interest expense, ground rent amortization, demolition costs, amortization, depreciation, development-related marketing costs and equity in earnings from Real Estate and Other Affiliates.
We use NOI to evaluate our operating performance on a property-by-property basis because NOI allows us to evaluate the impact that factors such as lease structure, lease rates and tenant base, which vary by property, have on our operating results, gross margins and investment returns.
Although we believe that NOI provides useful information to the investors about the performance of our Operating Assets due to the exclusions noted above, NOI should only be used as an alternative measure of the financial performance of such assets and not as an alternative to GAAP net income (loss).
|
Operating Assets NOI and REP EBT |
|||||||||||||||||||||||||
| Three Months Ended June 30, |
Six Months Ended June 30, |
||||||||||||||||||||||||
| (In thousands) | 2016 | 2015 | Change | 2016 | 2015 | Change | |||||||||||||||||||
| Retail | |||||||||||||||||||||||||
| Columbia Regional | $ | 297 | $ | 204 | $ | 93 | $ | 601 | $ | 465 | $ | 136 | |||||||||||||
| Cottonwood Square | 183 | 146 | 37 | 360 | 305 | 55 | |||||||||||||||||||
| Creekside Village Green (a) | 425 | 186 | 239 | 789 | 225 | 564 | |||||||||||||||||||
| Downtown Summerlin (a) | 4,028 | 2,450 | 1,578 | 8,241 | 4,194 | 4,047 | |||||||||||||||||||
| Hughes Landing Retail (a) | 864 | 328 | 536 | 1,523 | 387 | 1,136 | |||||||||||||||||||
| 1701 Lake Robbins | 95 | 15 | 80 | 183 | 184 | (1 | ) | ||||||||||||||||||
| Landmark Mall (b) | (173 | ) | (109 | ) | (64 | ) | (324 | ) | (186 | ) | (138 | ) | |||||||||||||
| Outlet Collection at Riverwalk (c) | 1,120 | 1,966 | (846 | ) | 2,232 | 3,119 | (887 | ) | |||||||||||||||||
| Park West (d) | 437 | 535 | (98 | ) | 936 | 1,175 | (239 | ) | |||||||||||||||||
| Ward Village (e) | 7,296 | 6,700 | 596 | 11,891 | 13,015 | (1,124 | ) | ||||||||||||||||||
| 20/25 Waterway Avenue | 386 | 526 | (140 | ) | 839 | 947 | (108 | ) | |||||||||||||||||
| Waterway Garage Retail | 145 | 184 | (39 | ) | 297 | 354 | (57 | ) | |||||||||||||||||
| Total Retail | 15,103 | 13,131 | 1,972 | 27,568 | 24,184 | 3,384 | |||||||||||||||||||
| Office | |||||||||||||||||||||||||
| 10-70 Columbia Corporate Center (f) | 3,257 | 3,291 | (34 | ) | 6,069 | 6,524 | (455 | ) | |||||||||||||||||
| Columbia Office Properties (g) | 87 | 65 | 22 | (117 | ) | 80 | (197 | ) | |||||||||||||||||
| One Hughes Landing | 1,482 | 1,314 | 168 | 3,005 | 2,636 | 369 | |||||||||||||||||||
| Two Hughes Landing (a) | 1,359 | 648 | 711 | 2,658 | 851 | 1,807 | |||||||||||||||||||
| 1725 Hughes Landing Boulevard (h) | (550 | ) | — | (550 | ) | (1,148 | ) | — | (1,148 | ) | |||||||||||||||
| 1735 Hughes Landing Boulevard (h) | 48 | — | 48 | (576 | ) | — | (576 | ) | |||||||||||||||||
| 2201 Lake Woodlands Drive | (34 | ) | (34 | ) | — | (70 | ) | (86 | ) | 16 | |||||||||||||||
| 9303 New Trails | 429 | 490 | (61 | ) | 855 | 983 | (128 | ) | |||||||||||||||||
| 110 N. Wacker | 1,526 | 1,529 | (3 | ) | 3,051 | 3,058 | (7 | ) | |||||||||||||||||
| ONE Summerlin (a) | 553 | (139 | ) | 692 | 838 | (169 | ) | 1,007 | |||||||||||||||||
| 3831 Technology Forest Drive | 528 | 538 | (10 | ) | 915 | 928 | (13 | ) | |||||||||||||||||
| 3 Waterway Square | 1,662 | 1,697 | (35 | ) | 3,393 | 3,171 | 222 | ||||||||||||||||||
| 4 Waterway Square | 1,627 | 1,482 | 145 | 3,303 | 2,942 | 361 | |||||||||||||||||||
| 1400 Woodloch Forest | 466 | 435 | 31 | 927 | 763 | 164 | |||||||||||||||||||
| Total Office | 12,440 | 11,316 | 1,124 | 23,103 | 21,681 | 1,422 | |||||||||||||||||||
| Multi-family | |||||||||||||||||||||||||
| 85 South Street | 124 | 108 | 16 | 250 | 215 | 35 | |||||||||||||||||||
| Millennium Waterway Apartments (i) | 709 | 993 | (284 | ) | 1,623 | 2,045 | (422 | ) | |||||||||||||||||
| One Lakes Edge (a) | 738 | (541 | ) | 1,279 | 1,656 | (541 | ) | 2,197 | |||||||||||||||||
| Total Multi-family | 1,571 | 560 | 1,011 | 3,529 | 1,719 | 1,810 | |||||||||||||||||||
| Hospitality | |||||||||||||||||||||||||
| Embassy Suites at Hughes Landing (h) | 867 | — | 867 | 1,568 | — | 1,568 | |||||||||||||||||||
| The Westin at The Woodlands (h) | 1,066 | — | 1,066 | 610 | — | 610 | |||||||||||||||||||
| The Woodlands Resort & Conference Center (j) | 2,955 | 2,588 | 367 | 5,143 | 5,513 | (370 | ) | ||||||||||||||||||
| Total Hospitality | 4,888 | 2,588 | 2,300 | 7,321 | 5,513 | 1,808 | |||||||||||||||||||
| Total Retail, Office, Multi-family, and Hospitality | 34,002 | 27,595 | 6,407 | 61,521 | 53,097 | 8,424 | |||||||||||||||||||
| The Woodlands Ground leases | 372 | 310 | 62 | 667 | 526 | 141 | |||||||||||||||||||
| The Woodlands Parking Garages | (28 | ) | (95 | ) | 67 | (190 | ) | (271 | ) | 81 | |||||||||||||||
| Other Properties | 896 | 955 | (59 | ) | 1,845 | 1,873 | (28 | ) | |||||||||||||||||
| Total Other | 1,240 | 1,170 | 70 | 2,322 | 2,128 | 194 | |||||||||||||||||||
| Operating Assets NOI - Consolidated and Owned | 35,242 | 28,765 | 6,477 | 63,843 | 55,225 | 8,618 | |||||||||||||||||||
| Redevelopments | |||||||||||||||||||||||||
| South Street Seaport (k) | (7 | ) | (387 | ) | 380 | (810 | ) | (401 | ) | (409 | ) | ||||||||||||||
| Dispositions | |||||||||||||||||||||||||
| The Club at Carlton Woods (l) | — | (847 | ) | 847 | — | (1,693 | ) | 1,693 | |||||||||||||||||
| Total Operating Assets NOI - Consolidated | 35,235 | 27,531 | 7,704 | 63,033 | 53,131 | 9,902 | |||||||||||||||||||
| Straight-line lease amortization (m) | 4,079 | 1,028 | 3,051 | 7,199 | 2,224 | 4,975 | |||||||||||||||||||
| Demolition costs (n) | (6 | ) | (1,496 | ) | 1,490 | (478 | ) | (1,613 | ) | 1,135 | |||||||||||||||
| Development-related marketing costs | (1,988 | ) | (2,748 | ) | 760 | (3,088 | ) | (5,014 | ) | 1,926 | |||||||||||||||
| Depreciation and Amortization | (22,613 | ) | (22,887 | ) | 274 | (43,814 | ) | (41,649 | ) | (2,165 | ) | ||||||||||||||
| Write-off of lease intangibles and other | (117 | ) | — | (117 | ) | (117 | ) | (154 | ) | 37 | |||||||||||||||
| Other income, net | 2,750 | — | 2,750 | 3,113 | — | 3,113 | |||||||||||||||||||
| Equity in earnings from Real Estate Affiliates | 899 | 160 | 739 | 2,826 | 1,044 | 1,782 | |||||||||||||||||||
| Interest, net | (10,108 | ) | (7,621 | ) | (2,487 | ) | (19,253 | ) | (14,105 | ) | (5,148 | ) | |||||||||||||
| Total Operating Assets REP EBT (o) | $ | 8,131 | $ | (6,033 | ) | $ |
14,164 |
$ | 9,421 | $ | (6,136 | ) | $ | 15,557 | |||||||||||
|
Operating Assets NOI and REP EBT |
|||||||||||||||||||||||||
| Three Months Ended June 30, |
Six Months Ended June 30, |
||||||||||||||||||||||||
| (In thousands) | 2016 | 2015 | Change | 2016 | 2015 | Change | |||||||||||||||||||
| Operating Assets NOI - Equity and Cost Method Investments | |||||||||||||||||||||||||
| Grandview SHG, LLC (h) | $ | 241 | $ | — | $ | 241 | $ | 309 | $ | — | $ | 309 | |||||||||||||
| Millennium Woodlands Phase II | 846 | 111 | 735 | 1,620 | 7 | 1,613 | |||||||||||||||||||
| Stewart Title Company | 312 | 608 | (296 | ) | 520 | 999 | (479 | ) | |||||||||||||||||
| Summerlin Baseball Club | 919 | 803 | 116 | 600 | 569 | 31 | |||||||||||||||||||
| The Metropolitan Downtown Columbia (a) | 1,620 | 139 | 1,481 | 2,933 | (369 | ) | 3,302 | ||||||||||||||||||
| Woodlands Sarofim # 1 | 367 | 338 | 29 | 792 | 729 | 63 | |||||||||||||||||||
| Total NOI - equity investees | 4,305 | 1,999 | 2,306 | 6,774 | 1,935 | 4,839 | |||||||||||||||||||
| Adjustments to NOI (p) | (2,379 | ) | (774 | ) | (1,605 | ) | (6,062 | ) | (1,454 | ) | (4,608 | ) | |||||||||||||
| Equity Method Investments REP EBT | 1,926 | 1,225 | 701 | 712 | 481 | 231 | |||||||||||||||||||
| Less: Joint Venture Partner's Share of REP EBT | (1,027 | ) | (1,065 | ) | 38 | (502 | ) | (1,184 | ) | 682 | |||||||||||||||
| Equity in earnings from Real Estate and Other Affiliates | 899 | 160 | 739 | 210 | (703 | ) | 913 | ||||||||||||||||||
| Distributions from Summerlin Hospital Investment (q) | — | — | — | 2,616 | 1,747 | 869 | |||||||||||||||||||
| Segment equity in earnings from Real Estate and Other Affiliates | $ | 899 | $ | 160 | $ | 739 | $ | 2,826 | $ | 1,044 | $ | 1,782 | |||||||||||||
| Company's Share of Equity Method Investments NOI | |||||||||||||||||||||||||
| Grandview SHG, LLC | $ | 84 | $ | — | $ | 84 | $ | 108 | $ | — | $ | 108 | |||||||||||||
| Millennium Woodlands Phase II | 689 | 91 | 598 | 1,319 | 6 | 1,313 | |||||||||||||||||||
| Stewart Title Company | 156 | 304 | (148 | ) | 260 | 500 | (240 | ) | |||||||||||||||||
| Summerlin Baseball Club | 460 | 402 | 58 | 300 | 285 | 15 | |||||||||||||||||||
| The Metropolitan Downtown Columbia | 810 | 69 | 741 | 1,467 | (185 | ) | 1,652 | ||||||||||||||||||
| Woodlands Sarofim # 1 | 73 | 68 | 5 | 158 | 146 | 12 | |||||||||||||||||||
| Total NOI - equity investees | $ | 2,272 | $ | 934 | $ | 1,338 | $ | 3,612 | $ | 752 | $ | 2,860 | |||||||||||||
| Economic | As of June 30, 2016 | |||||||||
| (In thousands) | Ownership | Total Debt | Total Cash | |||||||
| Grandview SHG, LLC | 35.00 | % | $ | 18,590 | $ | 3,330 | ||||
| Millennium Woodlands Phase II | 81.43 | % | 37,700 | 1,128 | ||||||
| Stewart Title Company | 50.00 | % | — | 296 | ||||||
| Summerlin Baseball Club | 50.00 | % | — | 766 | ||||||
| The Metropolitan Downtown Columbia | 50.00 | % | 63,214 | 2,085 | ||||||
| Woodlands Sarofim # 1 | 20.00 | % | 5,784 | 884 | ||||||
| (a) | NOI increase for the quarter ended June 30, 2016 as compared to 2015 relates to continued increase in occupancy and/or stabilization of the property. | |
| (b) | The NOI losses in 2016 and 2015 are due to a decline in occupancy as the property loses tenants in anticipation of its redevelopment. | |
| (c) | The NOI decrease is due to higher than normal tenant recoveries in 2015. | |
| (d) | NOI decrease for the six month period ended June 30, 2016 is due to decreased occupancy in 2016 related to the move out of a tenant in May 2015. The space has been released and the new tenant is expected to occupy the space in the third quarter 2016. | |
| (e) | NOI decrease for the six months ended June 30, 2016 is primarily caused by an increase in the provision for doubtful accounts due to tenant’s bankruptcy filing. NOI increased for the three months ended June 30, 2016 due to a partial reversal of the provision as a result of the agreement to settle the lease which will result in a full recovery of the pre-petition receivables. | |
| (f) | NOI decrease is due to decreased occupancy in 2016 related to a lease expiration and related vacancy of a tenant in May 2015. | |
| (g) | NOI decrease for the six month period ended June 30, 2016 is due primarily to decreased occupancy related to water damage in 2015 and loss of tenants. We expect to acquire this property in October 2016. Amounts settled with insurers with respect to the water damage are being held in escrow pending the acquisition. | |
| (h) | Please refer to Condensed Consolidated Financial Statements on Form 10-Q for further discussion. | |
| (i) | NOI decrease is due to a decrease in rental rates to maintain occupancy during the leasing of our newly opened multi-family properties in The Woodlands. | |
| (j) | NOI decrease for the six months ended June 30, 2016 is due to lower group business. NOI increase for the three months ended June 30, 2016 due to slightly higher occupancy. | |
| (k) | NOI decrease for the six months ended June 30, 2016 is higher employment costs and professional expenses. NOI increase for the three months ended June 30, 2016 is due primarily to special event income. | |
| (l) | The Club at Carlton Woods was sold in September 2015. | |
| (m) | The increase is primarily due to new leases at Downtown Summerlin and 1725-1735 Hughes Landing Boulevard which were placed in service in the fourth quarter of 2015. | |
| (n) | The decrease in demolition costs is due to completion of the interior demolition of the Fulton Market Building and demolition of Pier 17 at Seaport. | |
| (o) |
For a detailed breakdown of our Operating Asset segment REP EBT, please refer to Note 16 - Segments in the condensed consolidated financial statements. |
|
| (p) | Adjustments to NOI include straight-line rent and market lease amortization, demolition costs, depreciation and amortization and non-real estate taxes. | |
| (q) | Distributions from the Summerlin Hospital are typically made one time per year in the first quarter. | |
|
Commercial Properties NOI |
|||||||||||||||||||
| Square Feet/Number of Units |
% Occupied | (a) |
Three Months |
Projected Annual Stabilized NOI |
(b) |
Debt Balance as |
(c) | ||||||||||||
| (In millions, except square feet/number of units and %) | |||||||||||||||||||
|
Commercial Properties - Stabilized |
|||||||||||||||||||
| Retail | |||||||||||||||||||
| Cottonwood Square | 77,080 | 95.7 | % | $ | 0.2 | $ | 0.7 | $ | — | ||||||||||
| 1701 Lake Robbins | 12,376 | 100.0 | 0.1 | 0.4 | 4.6 | ||||||||||||||
| Landmark Mall (d) | 440,325 | 32.0 | (d) | (0.2 | ) | (0.3 | ) | — | |||||||||||
| Park West | 249,363 | 79.5 | 0.4 | 1.8 | — | ||||||||||||||
| Ward Village | 1,133,141 | 90.2 | 7.3 | 25.6 | 238.7 | ||||||||||||||
| 20/25 Waterway Avenue | 50,062 | 100.0 | 0.4 | 1.6 | 14.0 | ||||||||||||||
| Waterway Garage Retail | 21,513 | 85.4 | 0.1 | 0.8 | — | ||||||||||||||
| Total Retail - Stabilized (d) | 1,983,860 | 89.1 |
%(d) |
$ | 8.3 | $ | 30.6 | $ | 257.3 | ||||||||||
| Office | |||||||||||||||||||
| 10-70 Columbia Corporate Center | 899,976 | 89.5 | % | $ | 3.3 | $ | 12.4 | $ | 100.0 | ||||||||||
| Columbia Office Properties (d) | 220,471 | 37.7 | (d) | 0.1 | 0.5 | — | |||||||||||||
| One Hughes Landing | 197,719 | 100.0 | 1.5 | 5.3 | 52.0 | ||||||||||||||
| 9303 New Trails | 97,553 | 82.8 | 0.4 | 1.8 | 12.6 | ||||||||||||||
| 110 N. Wacker | 226,000 | 100.0 | 1.5 | 6.1 | 24.6 | ||||||||||||||
| 3831 Technology Forest Drive | 95,078 | 100.0 | 0.5 | 1.9 | 22.6 | ||||||||||||||
| 3 Waterway Square | 232,021 | 100.0 | 1.7 | 6.3 | 52.0 | ||||||||||||||
| 4 Waterway Square | 218,551 | 100.0 | 1.6 | 5.5 | 36.8 | ||||||||||||||
| 1400 Woodloch Forest | 95,667 | 95.8 | 0.5 | 1.2 | — | ||||||||||||||
| Total Office - Stabilized (d) | 2,283,036 | 94.4 |
%(d) |
$ | 11.1 | $ | 41.0 | $ | 300.6 | ||||||||||
| Multi-family | |||||||||||||||||||
| 85 South Street | 21 | 95.5 | 0.1 | 0.6 | — | ||||||||||||||
| Millennium Waterway Apartments | 393 | 85.0 | 0.7 | 4.5 | 55.6 | ||||||||||||||
| Total Multi-family | 414 | 85.5 | % | $ | 0.8 | $ | 5.1 | $ | 55.6 | ||||||||||
| Hospitality | |||||||||||||||||||
| Grandview SHG, LLC (d) | 72 | 92.1 | 0.1 | — | 6.5 | ||||||||||||||
| Total Hospitality - Stabilized | 72 | 92.1 | % | $ | 0.1 | $ | — | $ | 6.5 | ||||||||||
| Other | |||||||||||||||||||
| Other Assets (e) | N/A | N/A | 1.8 | 4.5 | 1.2 | ||||||||||||||
| Total Other - Stabilized | $ | 1.8 | $ | 4.5 | $ | 1.2 | |||||||||||||
| Total Commercial Properties - Stabilized | $ | 22.1 | $ | 81.2 | $ | 621.2 | |||||||||||||
|
Commercial Properties - Recently Developed And Not Yet Stabilized |
|||||||||||||||||||
| Retail | |||||||||||||||||||
| Columbia Regional | 88,556 | 77.4 | 0.3 | 2.2 | 22.2 | ||||||||||||||
| Creekside Village Green | 74,669 | 84.5 | 0.4 | 1.9 | — | ||||||||||||||
| Downtown Summerlin | 801,421 | 72.1 | 4.0 | 32.0 | 293.7 | ||||||||||||||
| Hughes Landing Retail | 126,131 | 90.8 | 0.9 | 3.5 | 32.5 | ||||||||||||||
| One Lakes Edge Retail | 23,280 | 61.6 | — | — | — | ||||||||||||||
| Outlet Collection at Riverwalk | 264,274 | 86.8 | 1.1 | 7.5 | 56.1 | ||||||||||||||
| Total Retail - Not Stabilized | 1,378,331 | 77.5 | % | $ | 6.7 | $ | 47.1 | $ | 404.5 | ||||||||||
| Office | |||||||||||||||||||
| Two Hughes Landing | 197,714 | 93.8 | 1.4 | 5.1 | 48.0 | ||||||||||||||
| One Summerlin | 206,279 | 56.2 | 0.6 | — | (f) | — | |||||||||||||
| 1725 and 1735 Hughes Landing Boulevard | 649,237 | (g) | 74.1 | (0.5 | ) | 14.0 | 104.0 | ||||||||||||
| Total Office - Not Stabilized | 1,053,230 | 74.3 | % | $ | 1.5 | $ | 19.1 | $ | 152.0 | ||||||||||
| Multi-family | |||||||||||||||||||
| One Lakes Edge | 390 | 59.0 | 0.7 | 7.5 | 69.6 | ||||||||||||||
| The Metropolitan Downtown Columbia | 380 | 92.1 | 0.8 | 3.5 | 31.6 | ||||||||||||||
| Millennium Woodlands Phase II | 314 | 79.0 | 0.7 | 3.8 | 30.7 | ||||||||||||||
| Total Multi-family - Not Stabilized | 1,084 | 76.4 | % | $ | 2.2 | $ | 14.8 | $ | 131.9 | ||||||||||
| Hospitality | |||||||||||||||||||
| Embassy Suites at Hughes Landing | 205 | 74.4 | 0.9 | 4.5 | 28.8 | ||||||||||||||
| The Westin at The Woodlands | 302 | 46.7 | 1.1 | 10.5 | 49.8 | ||||||||||||||
| The Woodlands Resort & Conference Center | 406 | 48.1 | 3.0 | 16.5 | 85.0 | ||||||||||||||
| Total Hospitality - Not Stabilized | 913 | 53.5 | % | $ | 5.0 | $ | 31.5 | $ | 163.6 | ||||||||||
| Total Commercial Properties - Not Stabilized | $ | 15.4 | $ | 112.5 | $ | 852.0 | |||||||||||||
| (In millions, except square feet/number of units and %) | Square Feet/Number of Units |
% Occupied | (a) |
Three Months |
Projected Annual |
(b) |
Debt Balance as of |
(c) | |||||||
|
Under Construction or Renovation |
|||||||||||||||
| Retail | |||||||||||||||
| South Street Seaport | 362,000 | N/A | N/A | N/A | (h) | — | |||||||||
| Lakeland Village Center | 83,600 | N/A | N/A | 1.7 | 8.5 | ||||||||||
| Total Retail - Under Construction | 445,600 | N/A | % | $ | N/A | $ | 1.7 | $ | 8.5 | ||||||
| Office | |||||||||||||||
| One Merriweather | 199,000 | N/A | N/A | 5.1 | 4.0 | ||||||||||
| Three Hughes Landing | 321,394 | N/A | N/A | 7.6 | 33.2 | ||||||||||
| Total Office - Under Construction | 520,394 | N/A | % | $ | N/A | $ | 12.7 | $ | 37.2 | ||||||
| Multi-family | |||||||||||||||
| Constellation | 124 | N/A | N/A | 1.1 | 4.7 | ||||||||||
| m.flats | 437 | N/A | N/A | 4.0 | — | ||||||||||
| Total Multi-family - Under Construction | 561 | N/A | % | $ | N/A | $ | 5.1 | $ | 4.7 | ||||||
| Self Storage | |||||||||||||||
| HHC 242 Self Storage Facility | 657 | N/A | N/A | 0.8 | 0.9 | ||||||||||
| HHC 2978 Self Storage Facility | 784 | N/A | N/A | 0.8 | — | ||||||||||
| Total Self Storage - Under Construction | 1,441 | N/A | % | $ | N/A | $ | 1.6 | $ | 0.9 | ||||||
| Total Commercial Properties - Under Construction | $ | N/A | $ | 21.1 | $ | 51.3 | |||||||||
|
Total Commercial Properties |
|||||||||||||||
| Retail | |||||||||||||||
| Stabilized | 1,983,860 | 89.1 |
%(d) |
$ | 8.3 | $ | 30.6 | $ | 257.3 | ||||||
| Not Stabilized | 1,378,331 | 77.5 | 6.7 | 47.1 | 404.5 | ||||||||||
| Under Construction | 445,600 | N/A | N/A | 1.7 | 8.5 | ||||||||||
| Total Retail | 3,807,791 | 74.4 | % | $ | 15.0 | $ | 79.4 | $ | 670.3 | ||||||
| Office | |||||||||||||||
| Stabilized | 2,283,036 | 94.4 |
%(d) |
$ | 11.1 | $ | 41.0 | $ | 300.6 | ||||||
| Not Stabilized | 1,053,230 | 74.3 | 1.5 | 19.1 | 152.0 | ||||||||||
| Under Construction | 520,394 | N/A | N/A | 12.7 | 37.2 | ||||||||||
| Total Office | 3,856,660 | 76.2 | % | $ | 12.6 | $ | 72.8 | $ | 489.8 | ||||||
| Multi-family | |||||||||||||||
| Stabilized | 414 | 85.5 | % | $ | 0.8 | $ | 5.1 | $ | 55.6 | ||||||
| Not Stabilized | 1,084 | 76.4 | 2.2 | 14.8 | 131.9 | ||||||||||
| Under Construction | 561 | N/A | N/A | 5.1 | 4.7 | ||||||||||
| Total Multi-family | 2,059 | 57.4 | % | $ | 3.0 | $ | 25.0 | $ | 192.2 | ||||||
| Hospitality | |||||||||||||||
| Stabilized | 72 | 92.1 | % | $ | 0.1 | $ | — | $ | 6.5 | ||||||
| Not Stabilized | 913 | 53.5 | 5.0 | 31.5 | 163.6 | ||||||||||
| Under Construction | N/A | N/A | N/A | N/A | N/A | ||||||||||
| Total Hospitality | 985 | 56.4 | % | $ | 5.1 | $ | 31.5 | $ | 170.1 | ||||||
| Self Storage and Other | |||||||||||||||
| Stabilized | N/A | N/A | $ | 1.8 | $ | 4.5 | $ | 1.2 | |||||||
| Under Construction | 1,441 | N/A | N/A | 1.6 | 0.9 | ||||||||||
| Total Self Storage and Other | 1,441 | N/A | % | $ | 1.8 | $ | 6.1 | $ | 2.1 | ||||||
| Total Commercial Properties | $ | 37.5 | $ | 214.8 | $ | 1,524.5 | |||||||||
| Properties held in joint ventures | $ | 2.3 | $ | 16.9 | $ | 74.7 | |||||||||
| Properties-Consolidated and Owned | 35.2 | 197.9 | 1,449.8 | ||||||||||||
| Total Commercial Properties | $ | 37.5 | $ | 214.8 | $ | 1,524.5 | |||||||||
|
|
|||||||||||||||
| (a) | Percentage occupied is as of June 30, 2016 unless a more recent statistic is disclosed in the June 30, 2016 Form 10-Q filing or in this release. | |
| (b) |
For stabilized properties, Projected Annual Stabilized NOI generally represents the last twelve months of actual NOI generated by the property. For properties not stabilized or under construction, Projected Annual Stabilized NOI is shown based upon the most recent estimates disclosed in our periodic filings and/or earnings releases. We do not necessarily update these projections on a regular basis and such projections may vary based upon many factors, more fully described under “Forward-Looking Statements” and “Risk Factors” in our filings with the Securities and Exchange Commission. There can be no assurance as to when or if these properties will achieve Projected Annual Stabilized NOI. Furthermore, there has been no reconciliation made to a GAAP Net Income projection as none is available. Due to the uncertainty in timing of our development efforts of when properties will be placed in service, of when debt financing will be obtained, and the uncertainty of debt service costs, unreasonable effort would be required to produce a reconciliation. |
|
| (c) | Represents the outstanding balance of the mortgage debt directly attributable to the asset. The total debt balance excludes corporate and other debt not directly attributable to, or secured by, the properties. For investments in real estate and other affiliates, the debt amount represents our share based on our percentage ownership. | |
| (d) | Property is a redevelopment opportunity but is being operated to maximize cash flow “as is” until such time as we begin active redevelopment. Landmark Mall and Columbia Office Properties have been excluded from the % occupied for Total Retail – Stabilized and Total Office – Stabilized. | |
| (e) | Amount includes Other Operating Assets and our share of our Equity Method Investments NOI. The Grandview SHG, LLC, The Metropolitan Downtown Columbia Project, and Millennium Woodlands Phase II investments are disclosed separately within this schedule. | |
| (f) | One Summerlin projected annual stabilized NOI is included as part of Downtown Summerlin projected annual stabilized NOI. | |
| (g) | ExxonMobil has leased the entire 1735 Hughes Landing Boulevard building and 160,000 square feet of the 1725 Hughes Landing Boulevard building. We are seeking tenants for the remaining 171,067 square feet of the 1725 Hughes Landing Boulevard building. | |
| (h) | Amount not disclosed. |
The Howard Hughes Corporation
Caryn Kboudi, 214-741-7744
caryn.kboudi@howardhughes.com
Source: The Howard Hughes Corporation